Reading time 3 mins
Introduction
This article provides an overview of the Analytics Dashboards that are available to be imported into your Radar Healthcare instance, as well the files for those dashboards.
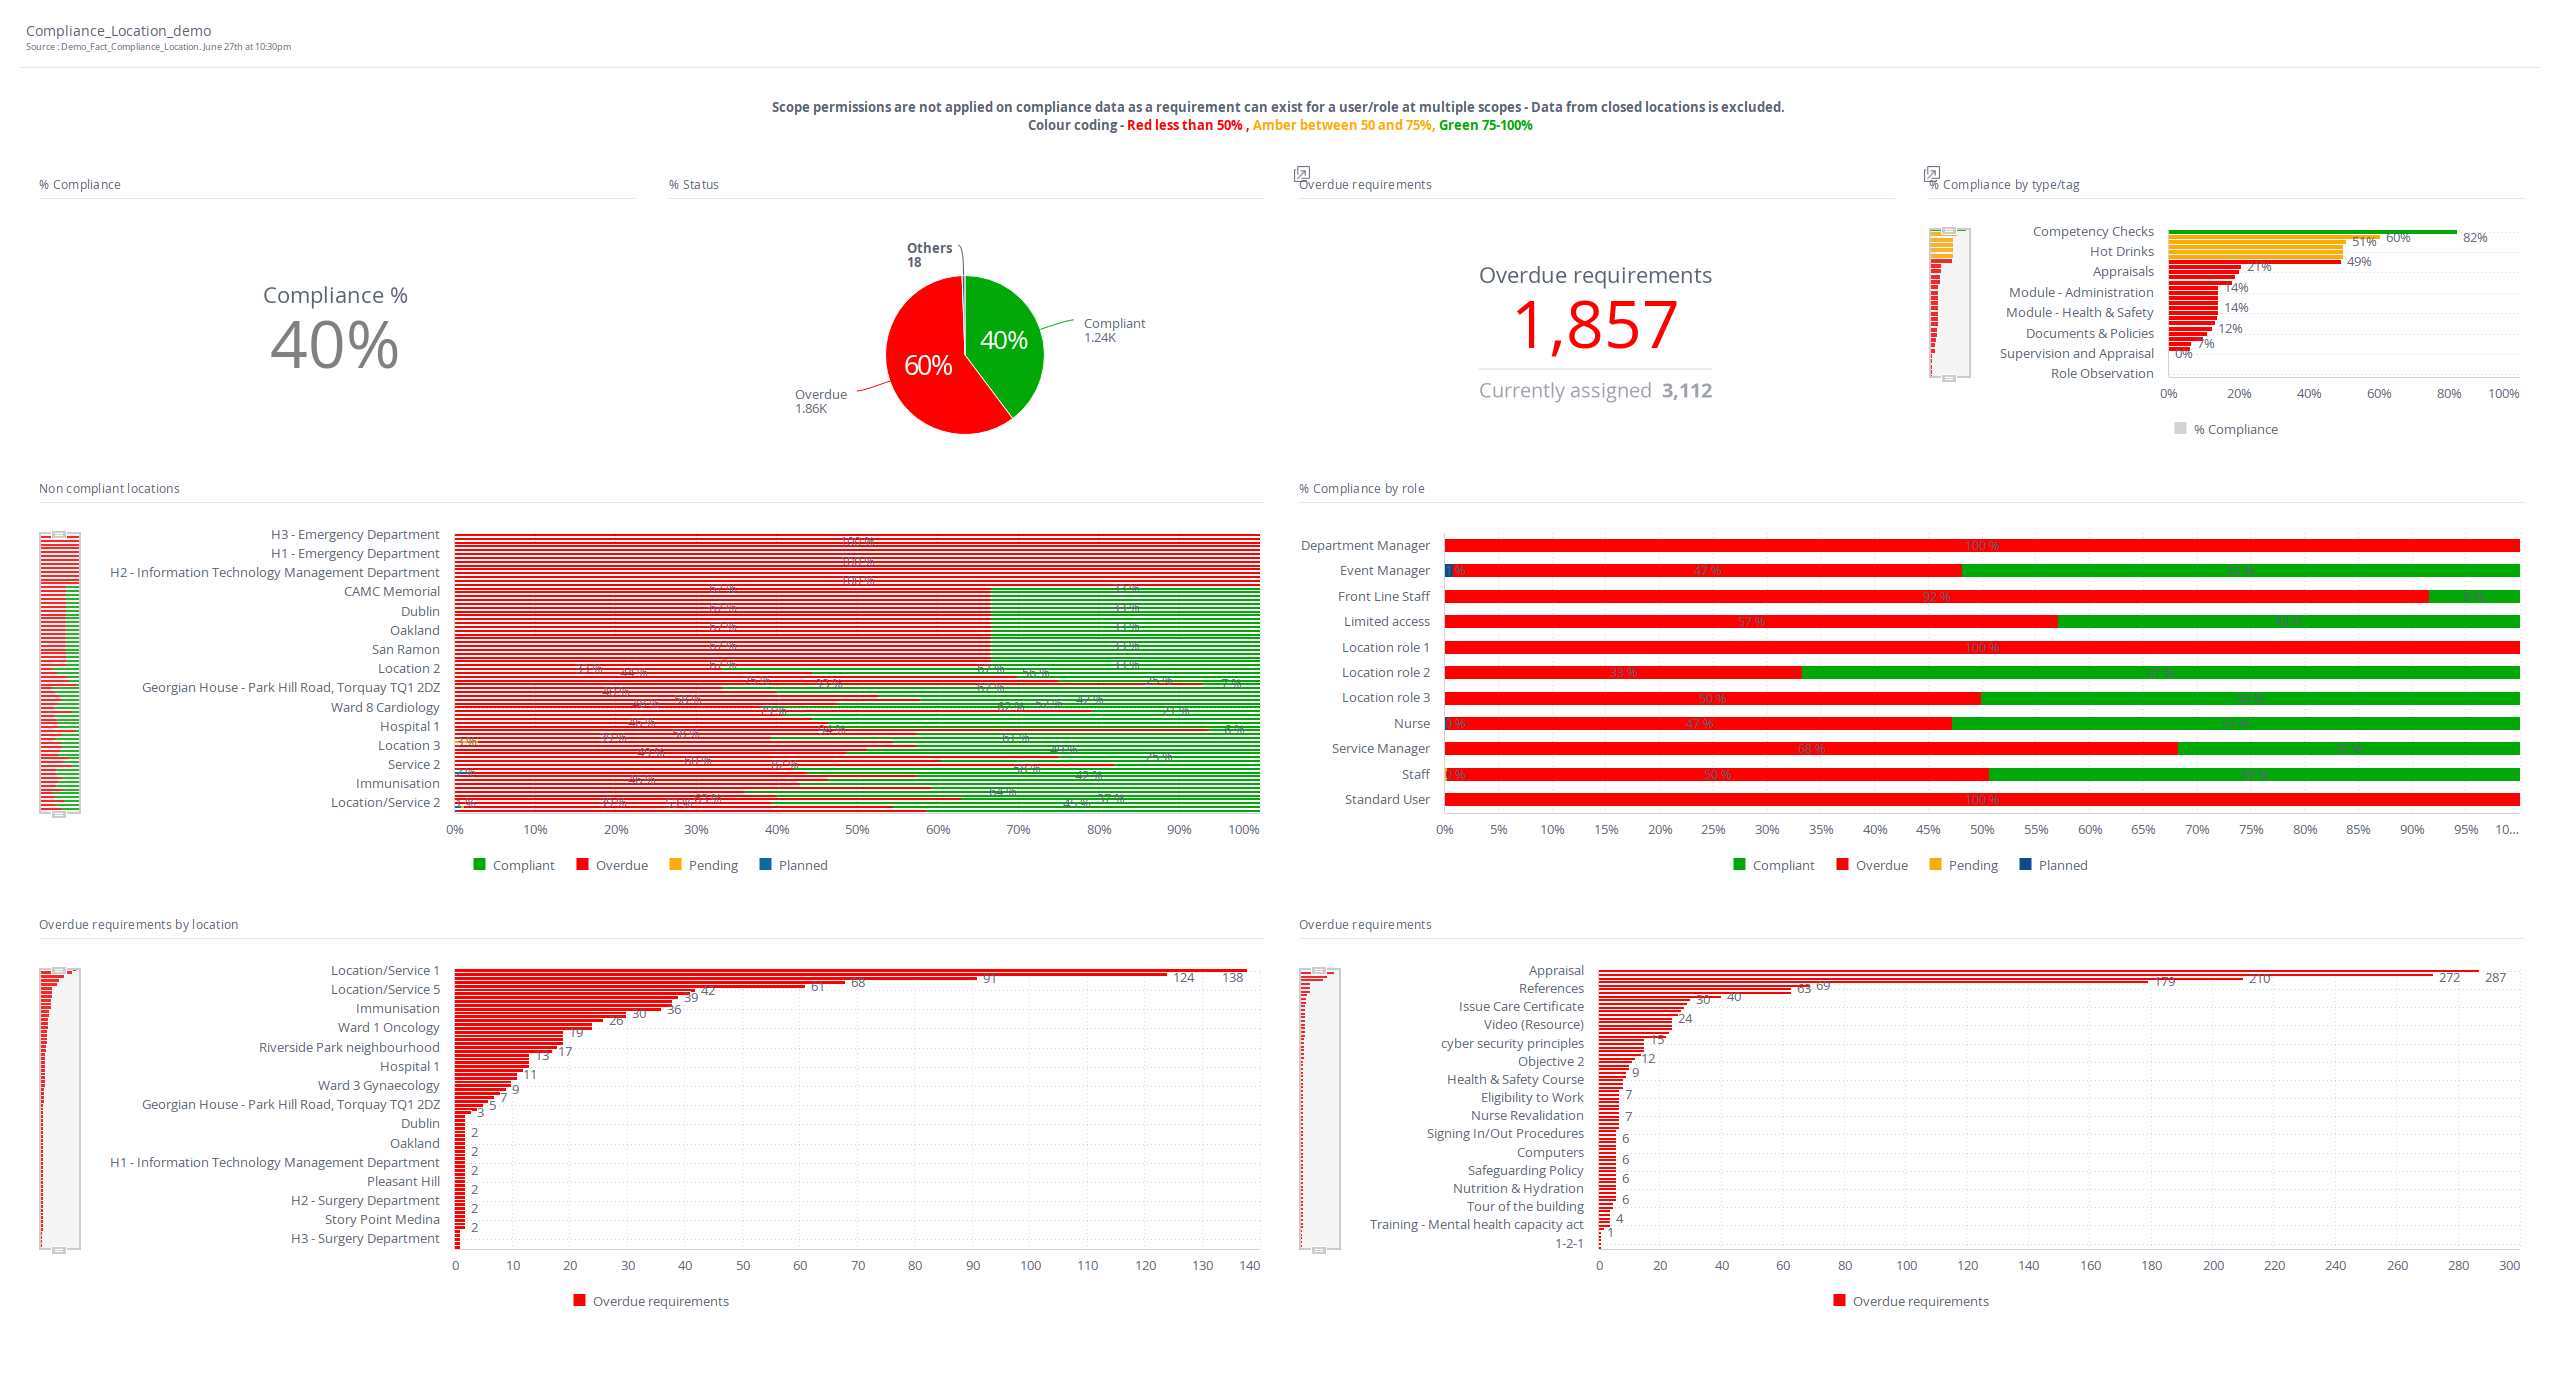
Below, we have listed the dashboards that are available to you, along with a description of the data it presents and a preview image.
Should you wish to import that dashboard into your system, simply click the file icon at the bottom of this article to download the dashboard files, you can then upload these into your Radar Healthcare system.
Please note that the dashboards widgets will need updating to align them with the data in your own data cubes.
You can find a complete guide to the analytics dashboards available in Radar Healthcare on our Analytics Dashboards Index.
Where To Find Dashboards
If you have relevant permissions, you will be able to access Analytics dashboards following the 3 steps below:
- Go to Dashboard at the top of the left-hand menu
- Click on ‘Analytics’ across the top
- Click the folders in the Dashboard menu on the left
The dashboards contain:
- Key stats and metrics e.g. Number of Incidents reported, Average Audit Scores
- Bar charts to compare metrics e.g. Number of tasks by Location, User, Status
- Line graphs to illustrate trends over time e.g. Number of incidents reported over time, audit completion rates
Importing Dashboard Files Into Your System
To import the dashboard file into your instance, just follow the below steps:
- Download the file(s) you wish from this page. You can do so by downloading the zip file that appears at the bottom of this guide.
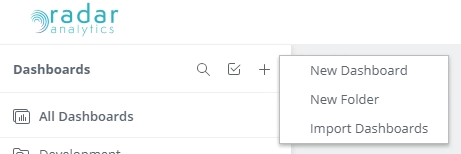
- Login to your Customer Builder
- Click Import and select the dashboard file
If you are loading one of our test files, please be aware:
- The data source will be automatically set to Test_Fact_Events
- To change this, just click the data source and select your own events
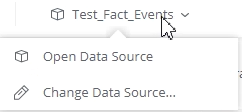
- Review the dashboard to ensure the widget data is aligned to the right data source. The dashboard file represents a framework and the data simply requires reassigning.
Dashboards Available To You
Action Plan Dashboards
| Dashboard Names | Description |
|---|---|
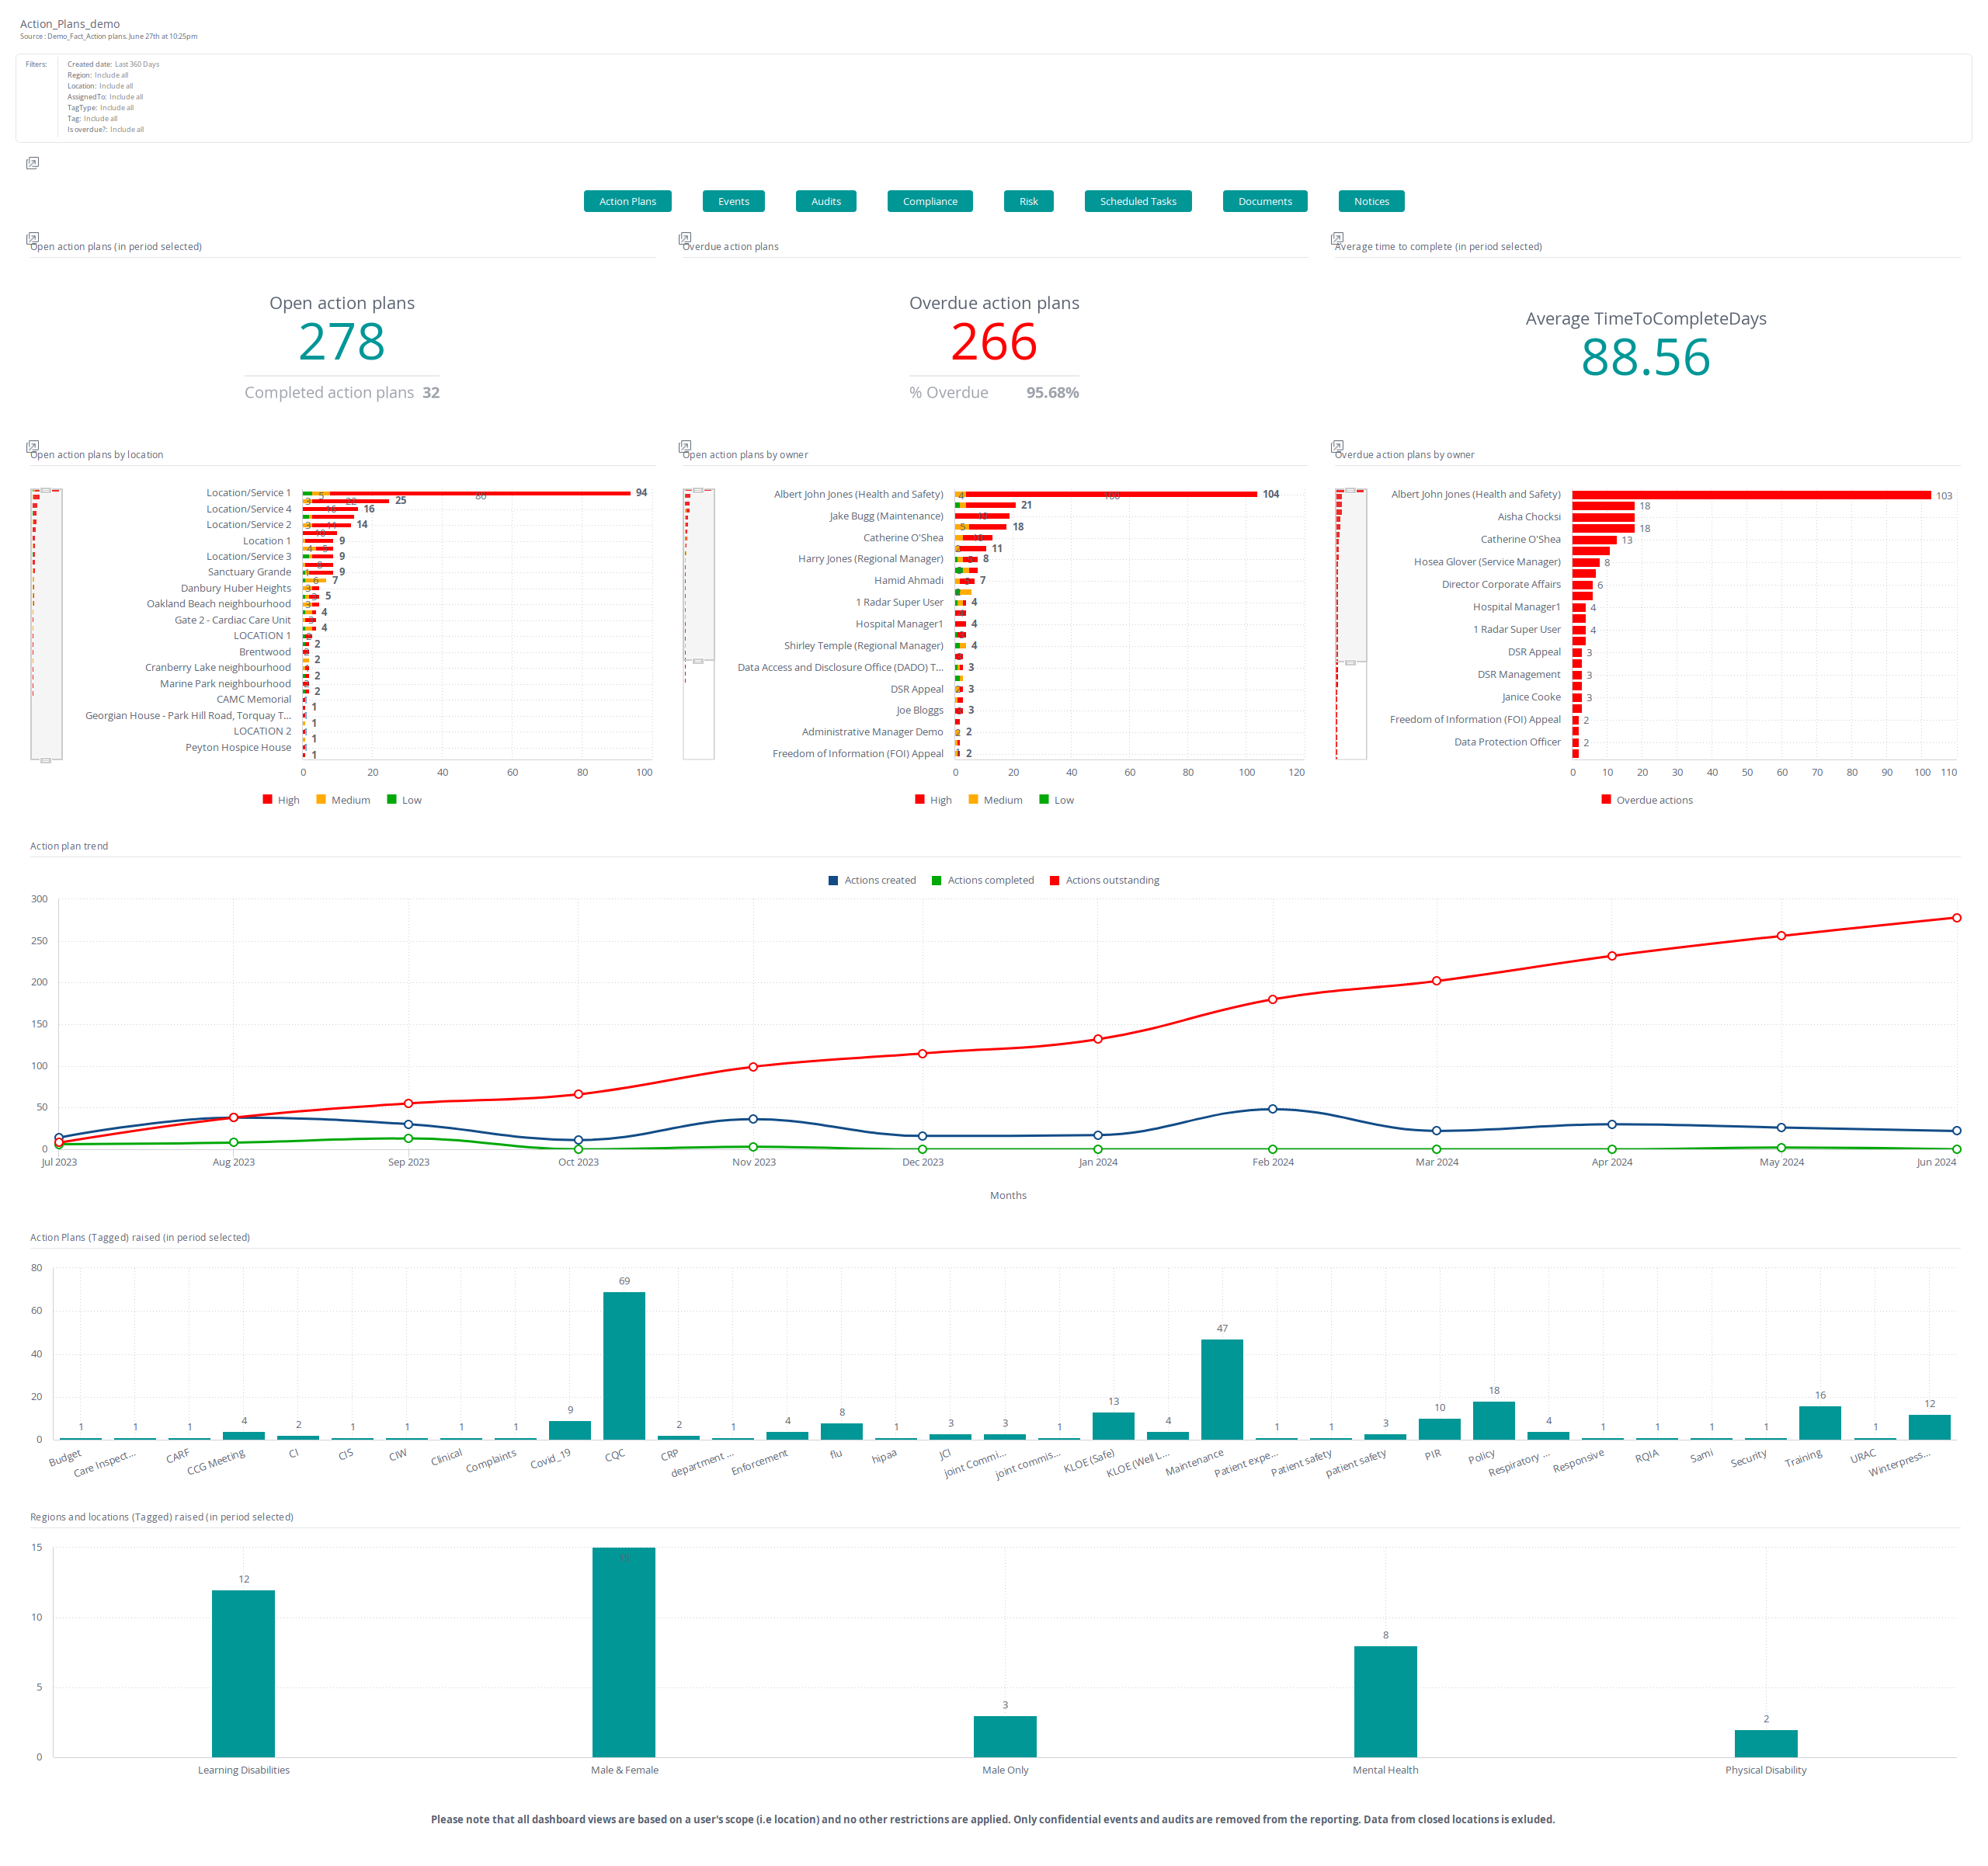
| Action_Plans | This is your core overview of your action plans. Track key metrics including; the number of Action Plans created, open, overdue, completed by location, owner and more, within a given time period. This dashboard accounts for a user's scope (i.e location). Data from closed locations are not included. Use this dashboard to stay on top of overdue tasks and track your teams’ engagement with actions.
|
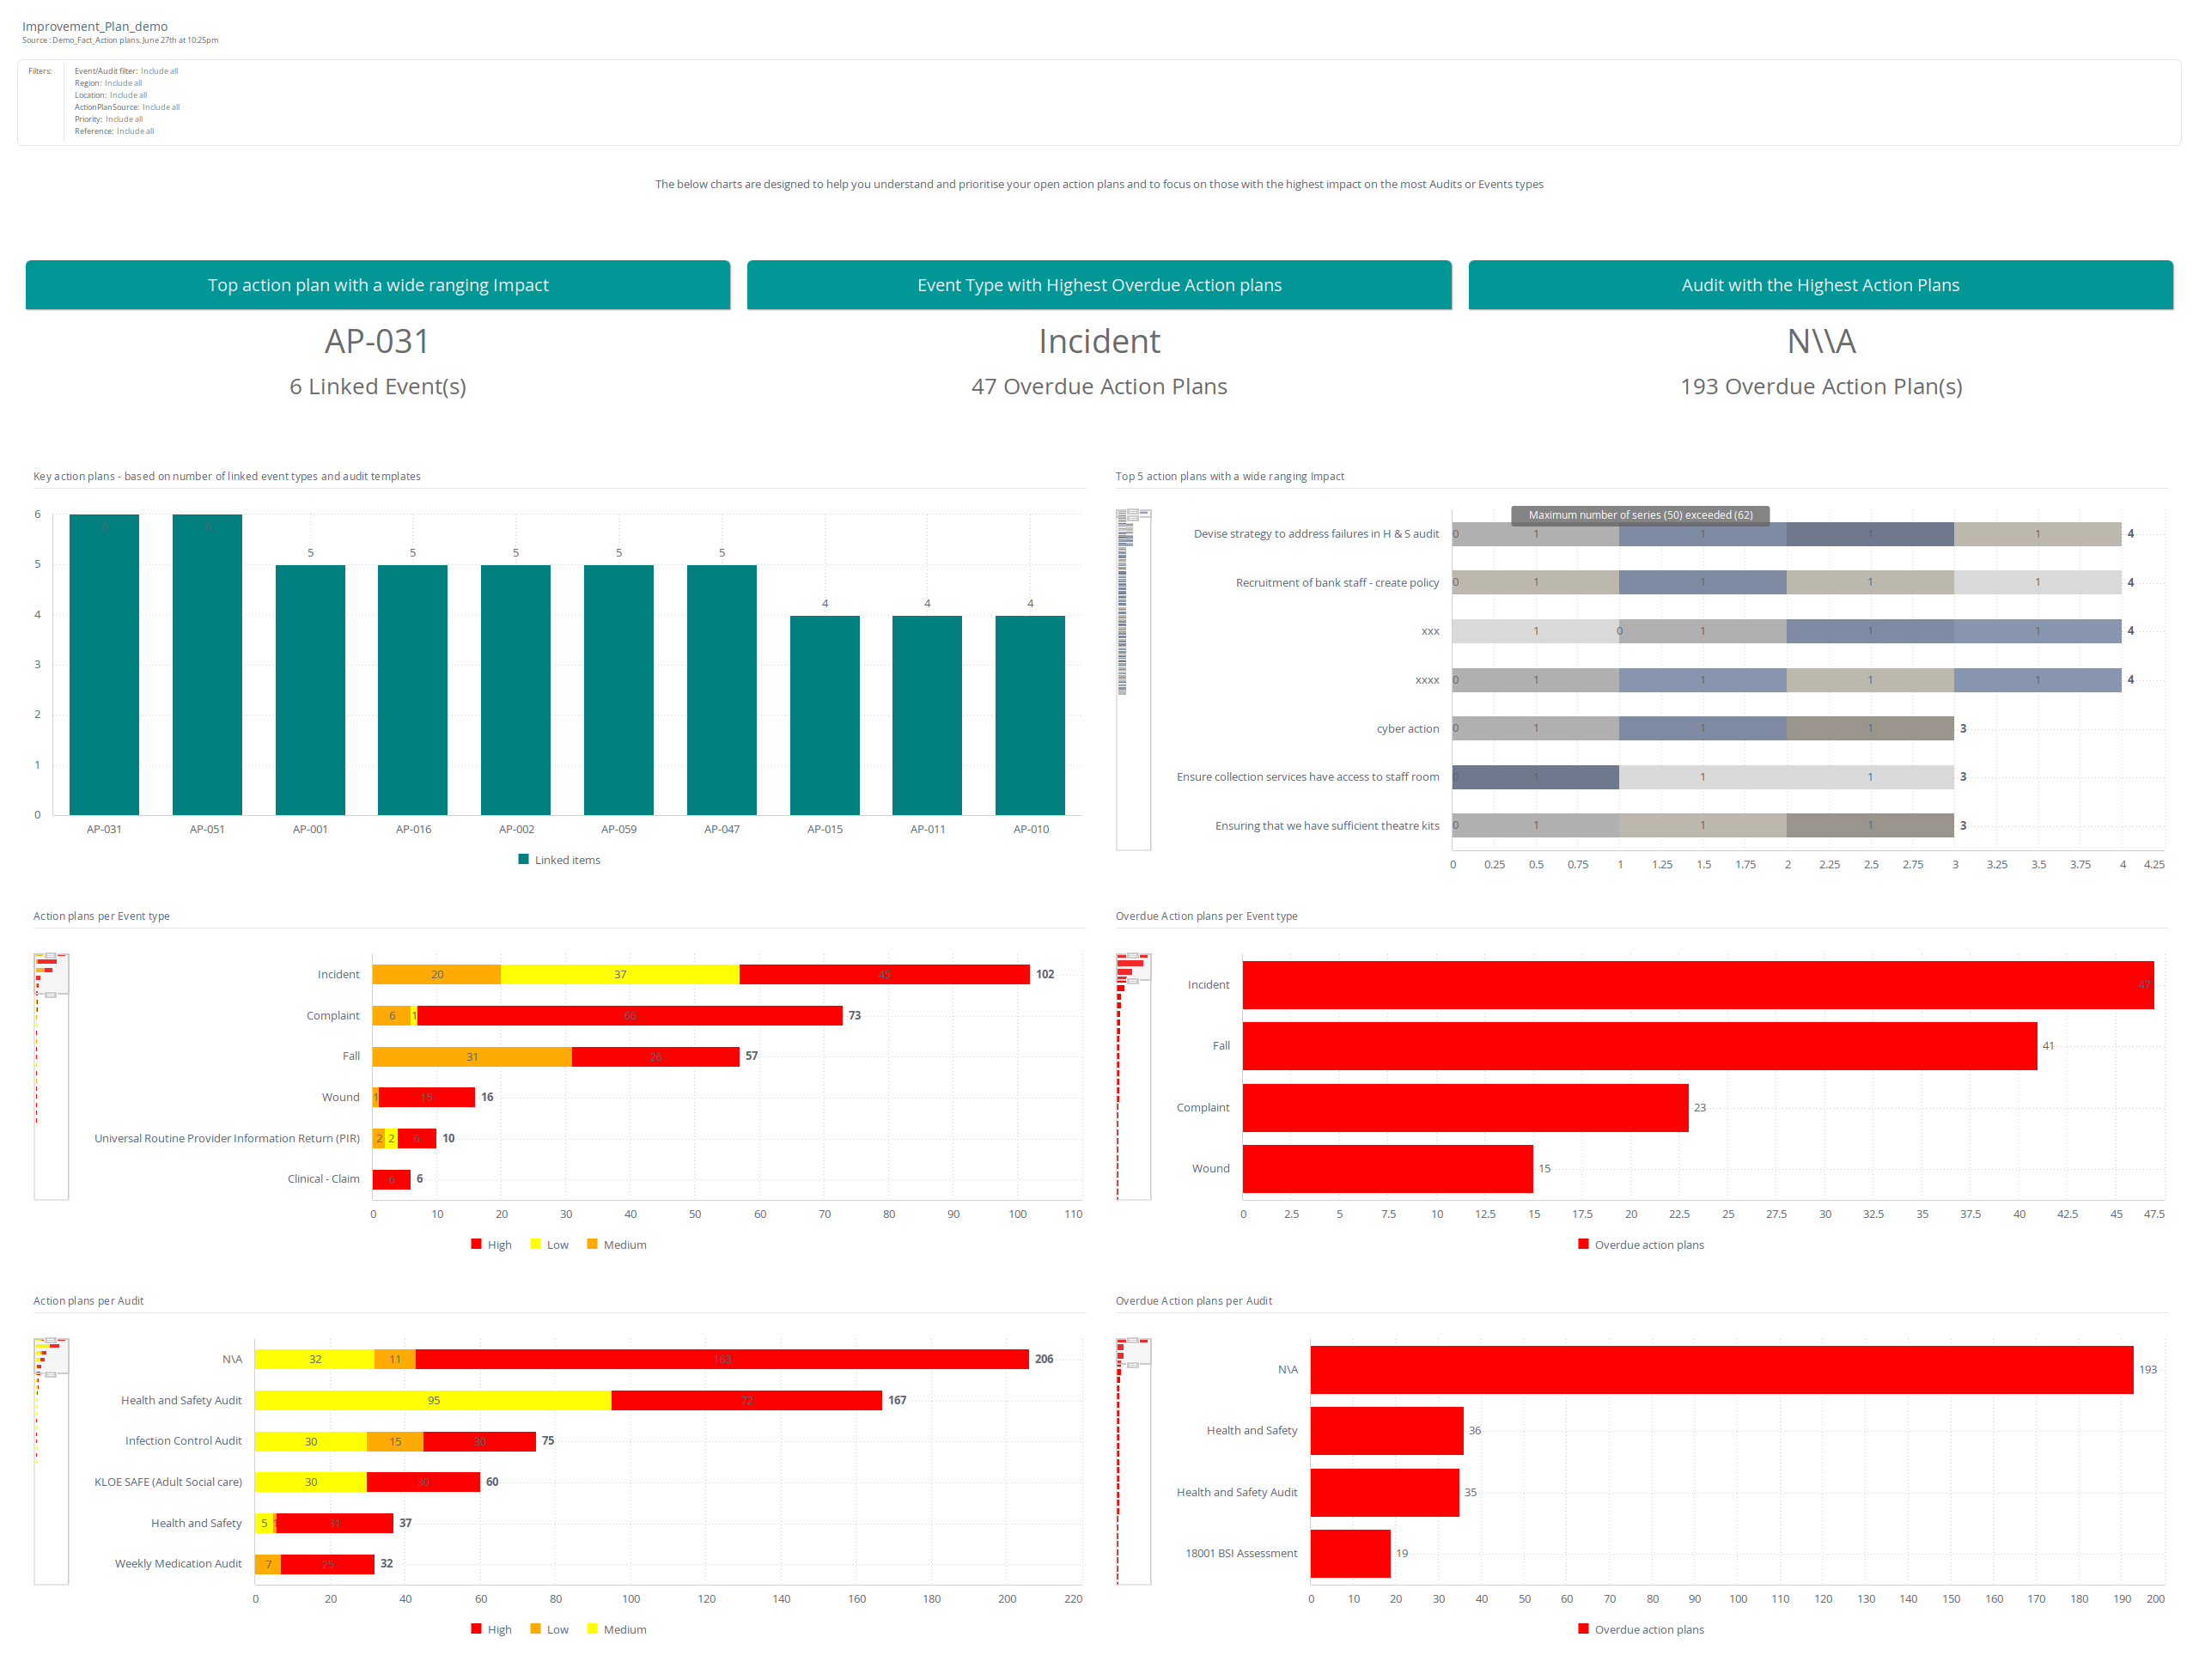
| Improvement_Plan | Data includes an overview of outstanding actions that are linked to Audits and Events. Identify actions that will have the biggest impact when completed to focus effort on priorities. |
Audit Dashboards
| Dashboard Names | Description |
|---|---|
| Audit_Crystal_Ball | Use this dashboard to forecast future audit scores using your existing data in your system. This requires a minimum of 3 months data before using. |

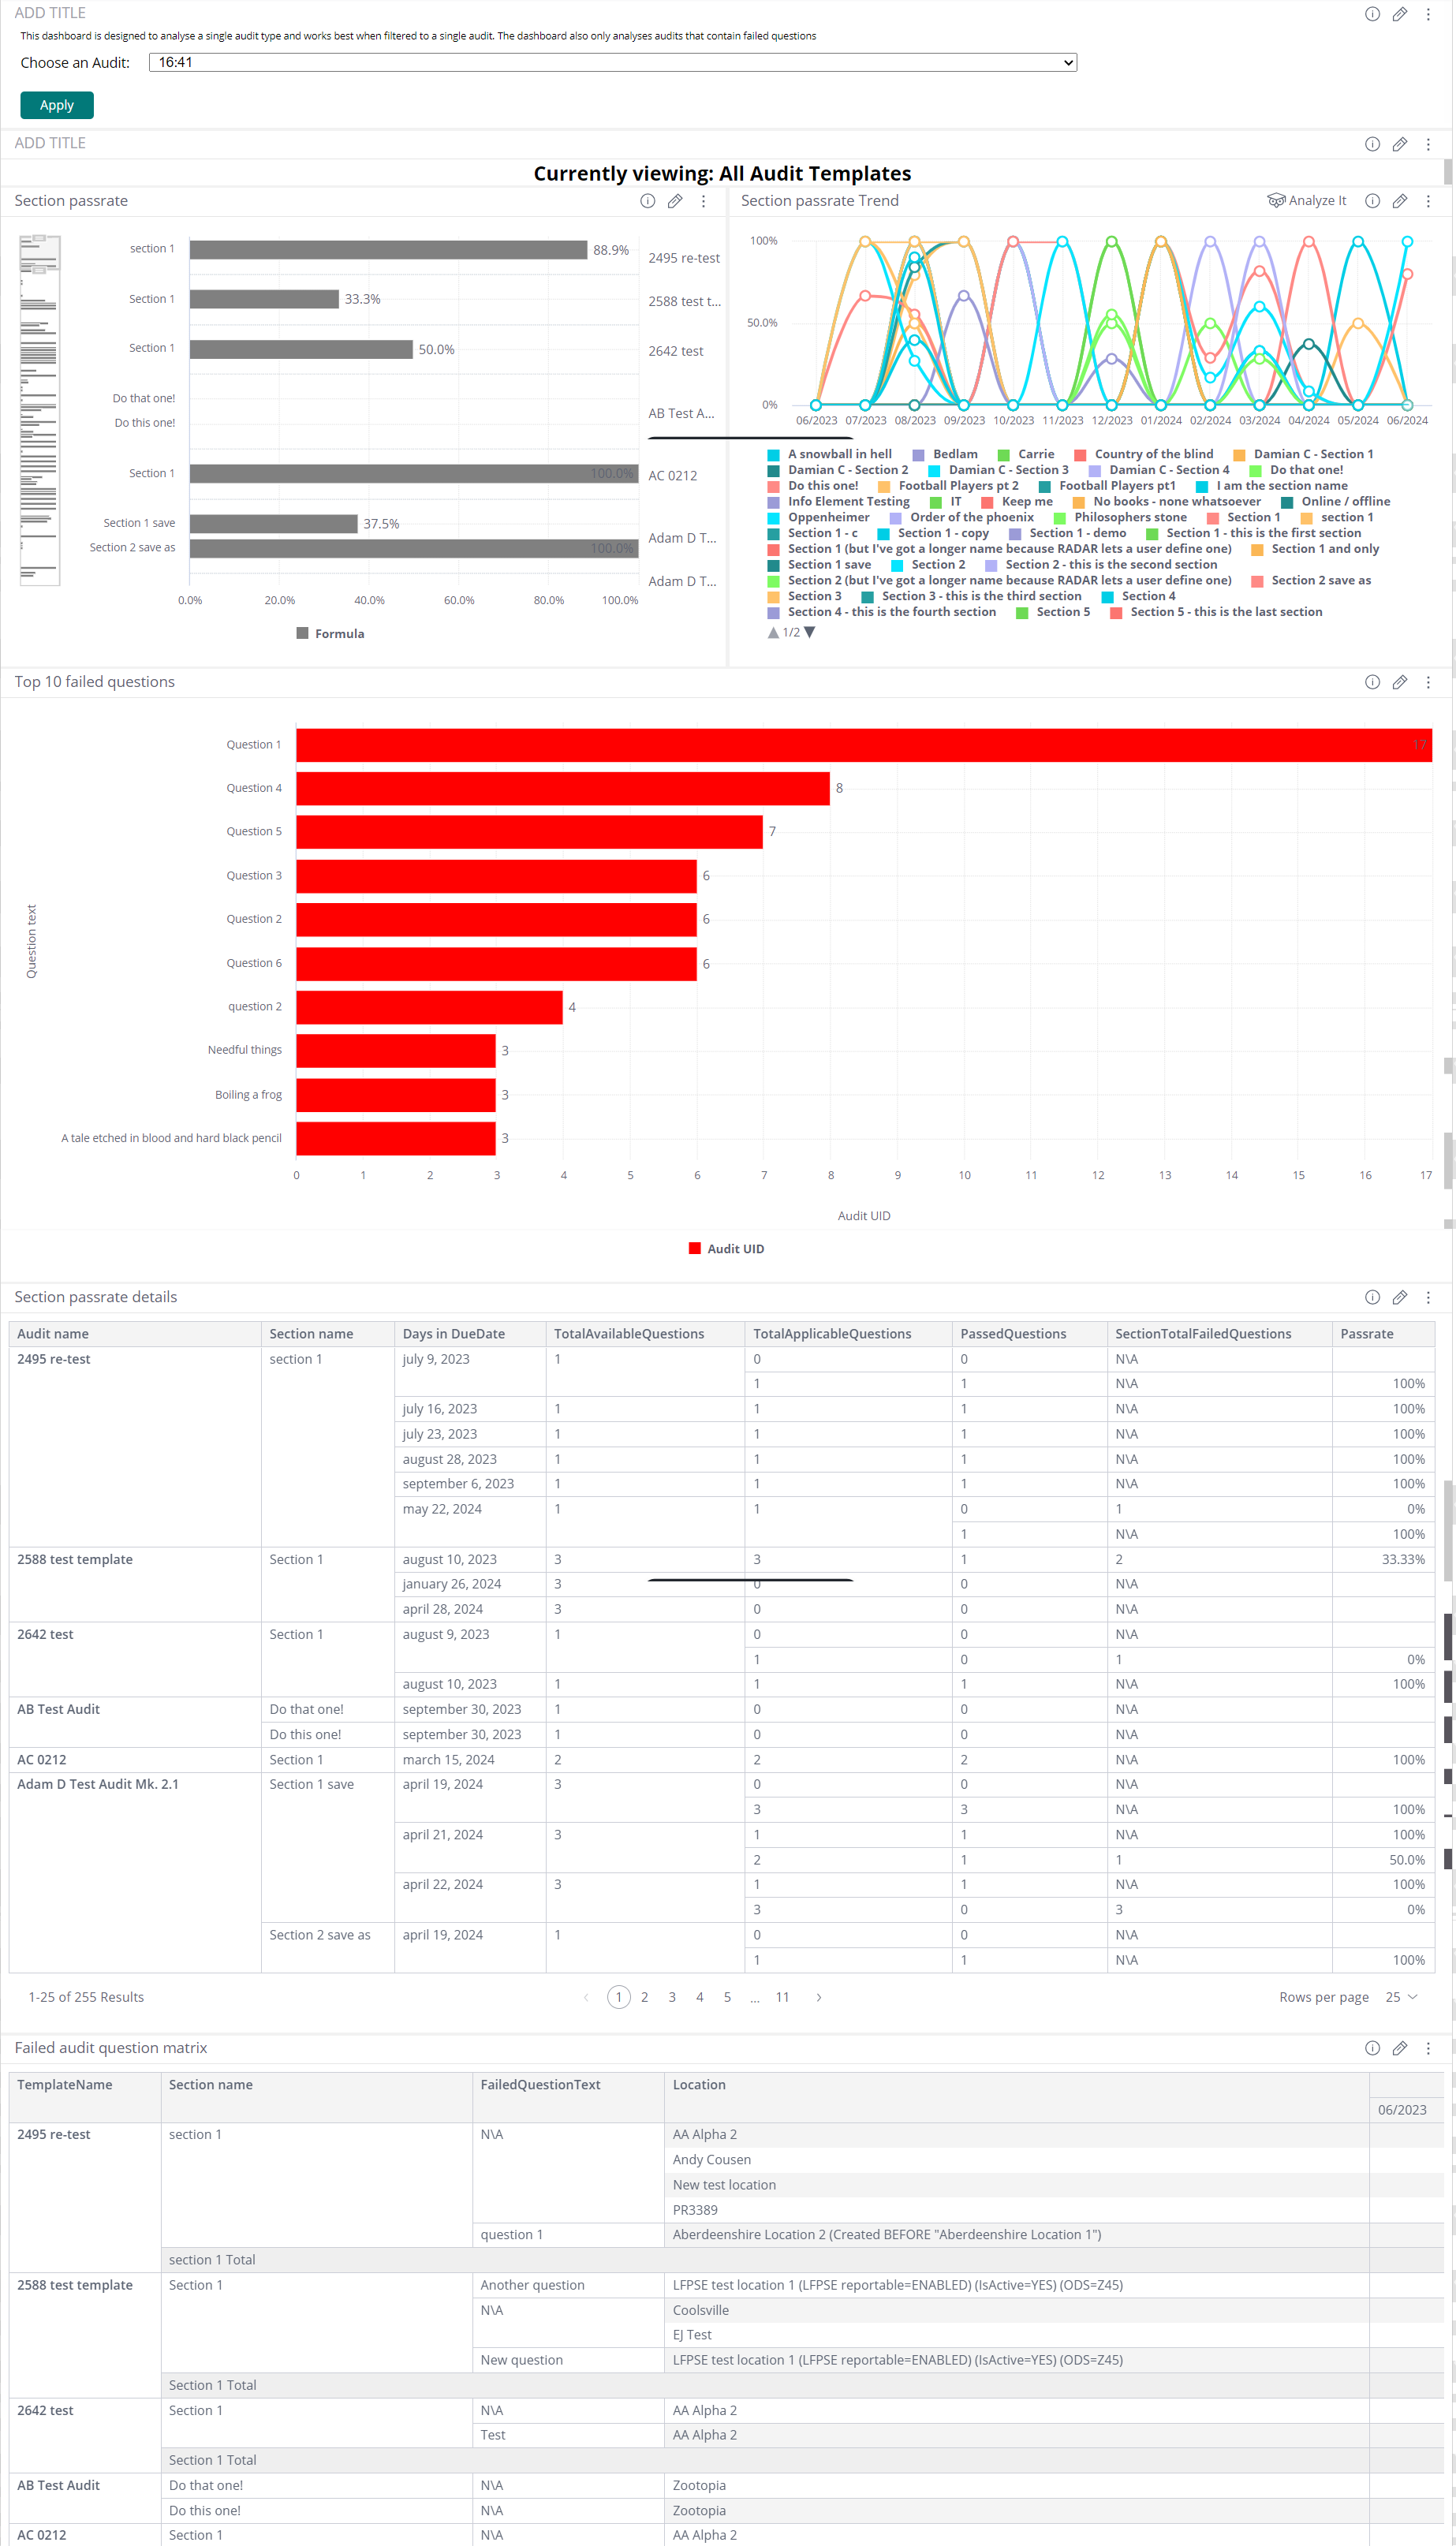
| Audits_Failedquestion | This dashboard is designed to focus on individual audit templates for you to focus on questions failing across your Region or Organisation. Filter by audit to identify which questions commonly fail and where you can focus improvements to help your teams most. |
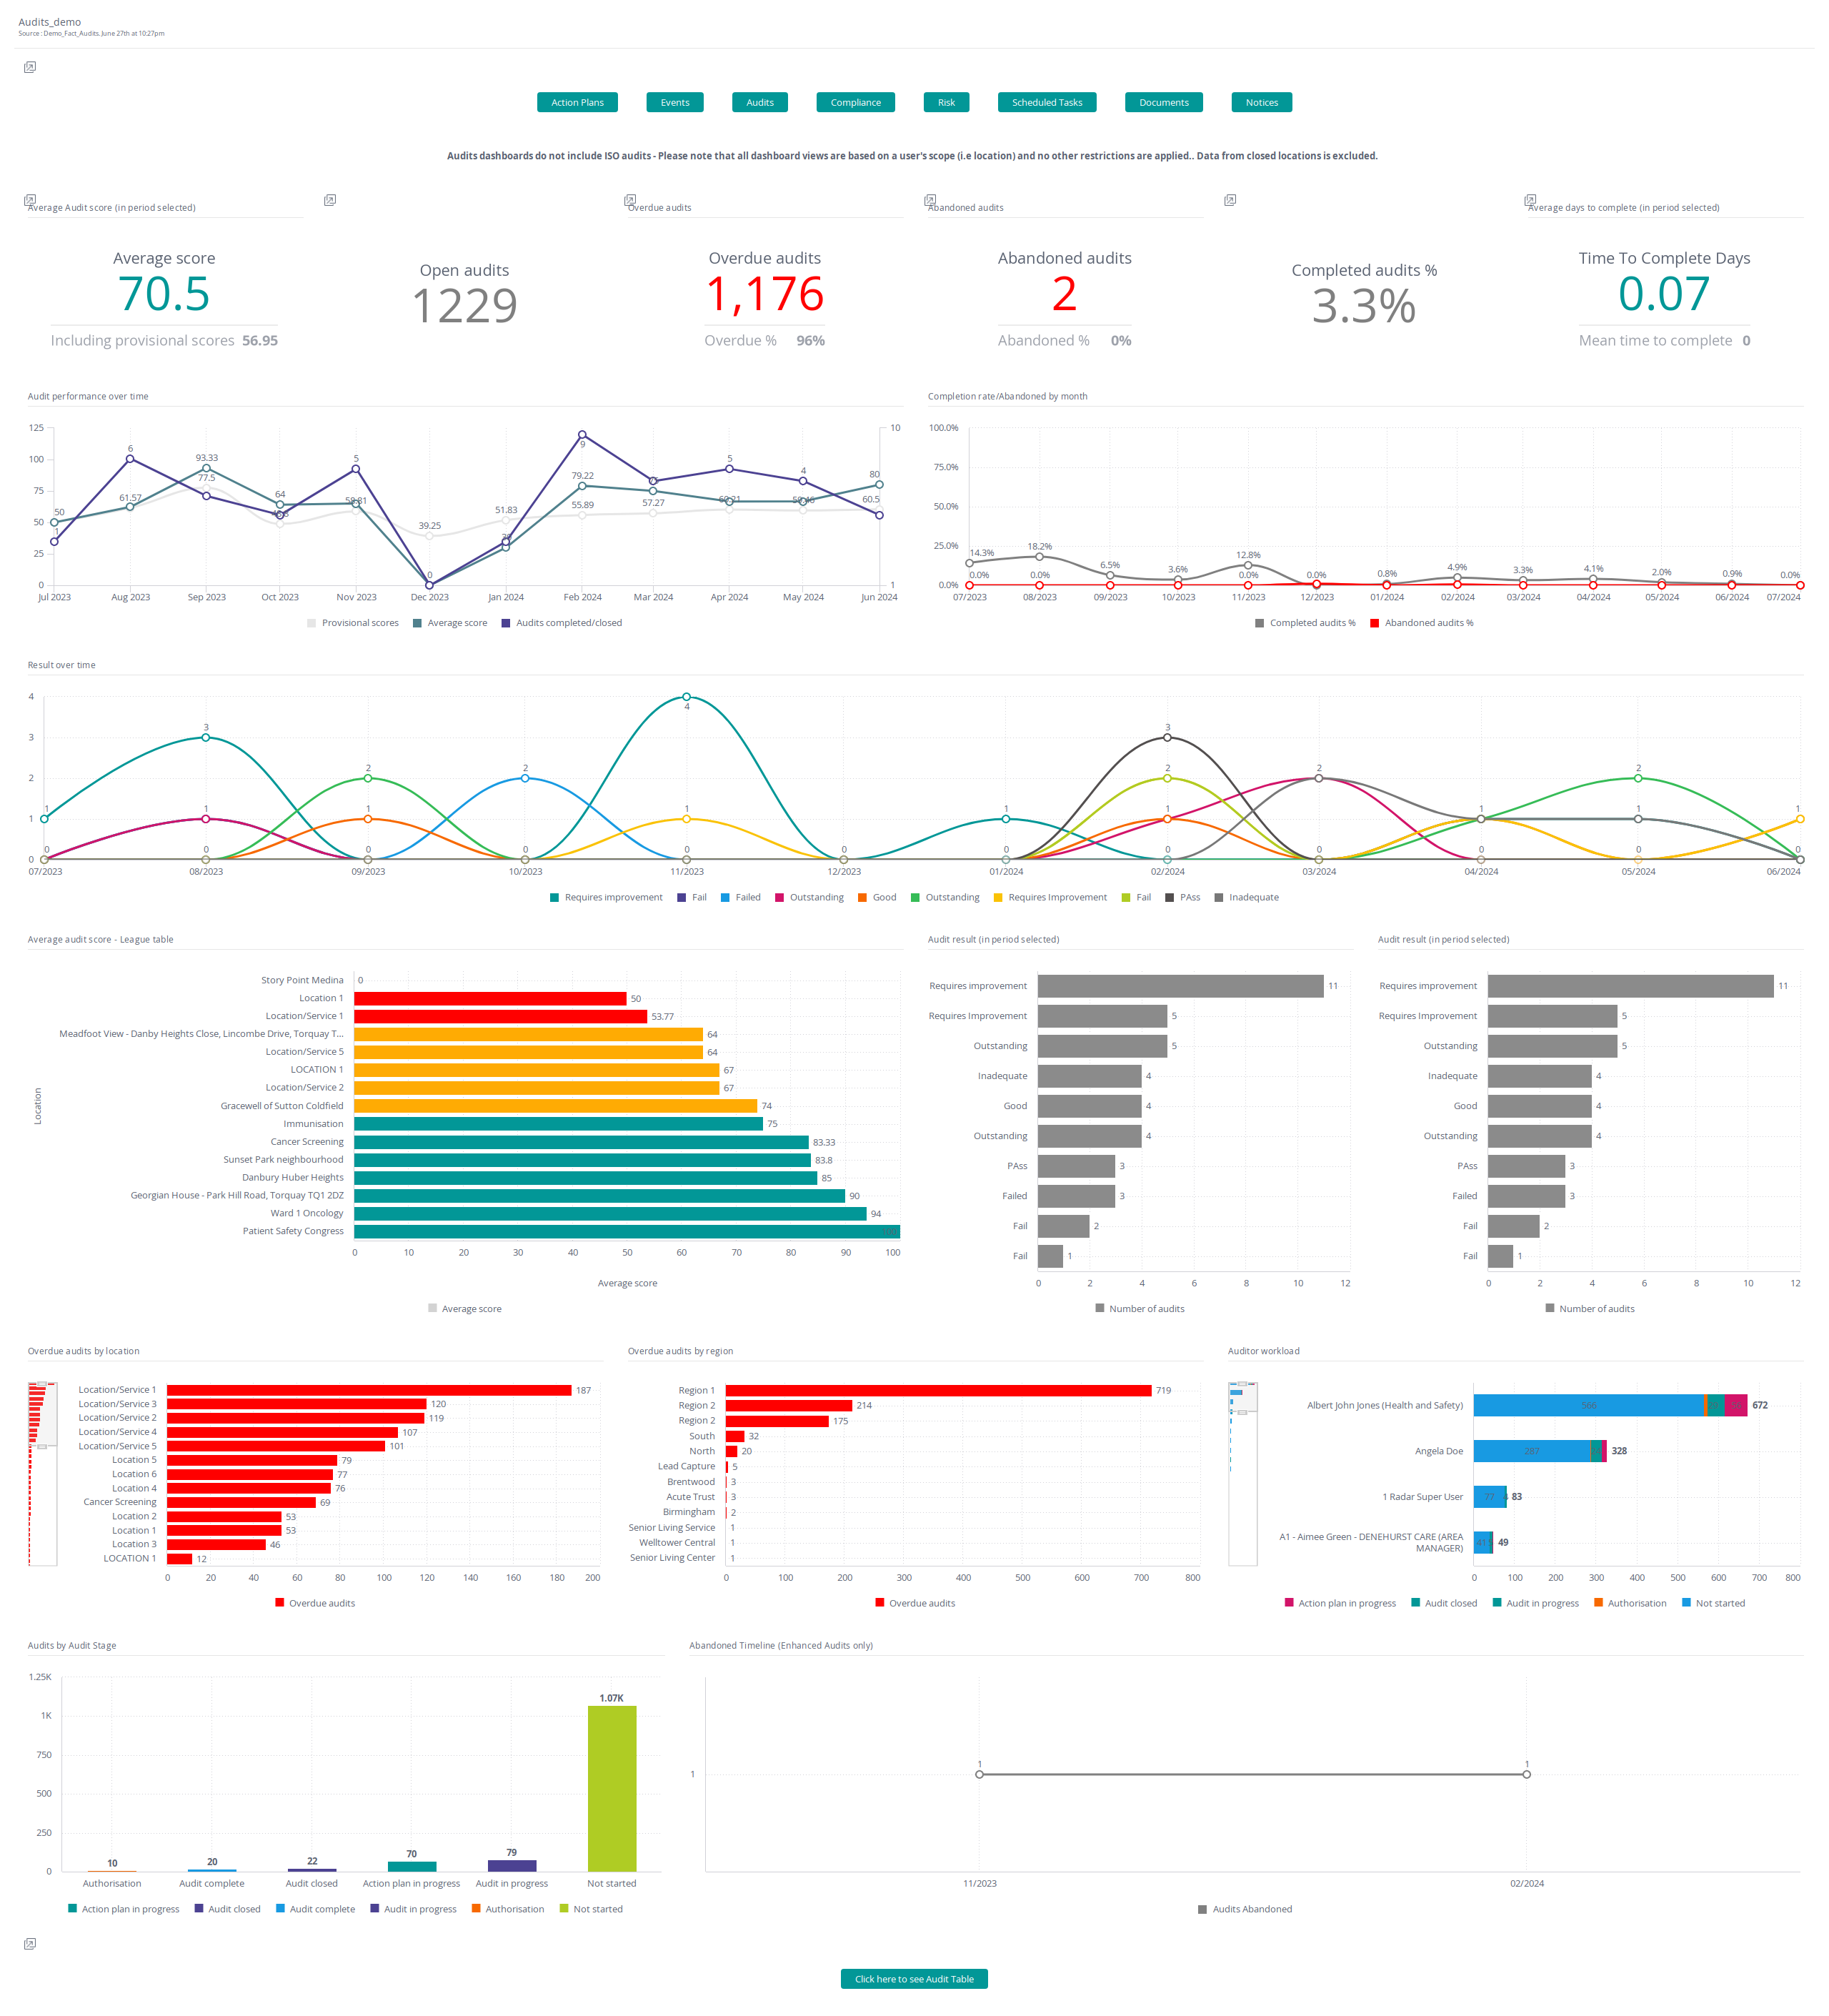
| Audits | This is your core overview of your audits. Data includes average scores, overdue audits, audit completion rates within a given time period, audit performance over time, audit scores by locations (and more). Audits dashboards do not include ISO audits. This dashboard accounts for a user's scope (i.e. location). Confidential audits and data from closed locations are not included. Use this dashboard to stay on top of overdue tasks and track your teams’ engagement with audits. |
Document Dashboards
| Dashboard Names | Description |
|---|---|
| Document_Downloads | This dashboard focuses on the user's downloading of the documents. Data includes the number of downloads, downloads by function (e.g. notices), list of downloading activity, and more. A table overview of which documents have been downloaded from your Radar Healthcare system. Use this dashboard to find out what your most commonly accessed documents are and who has downloaded them. |

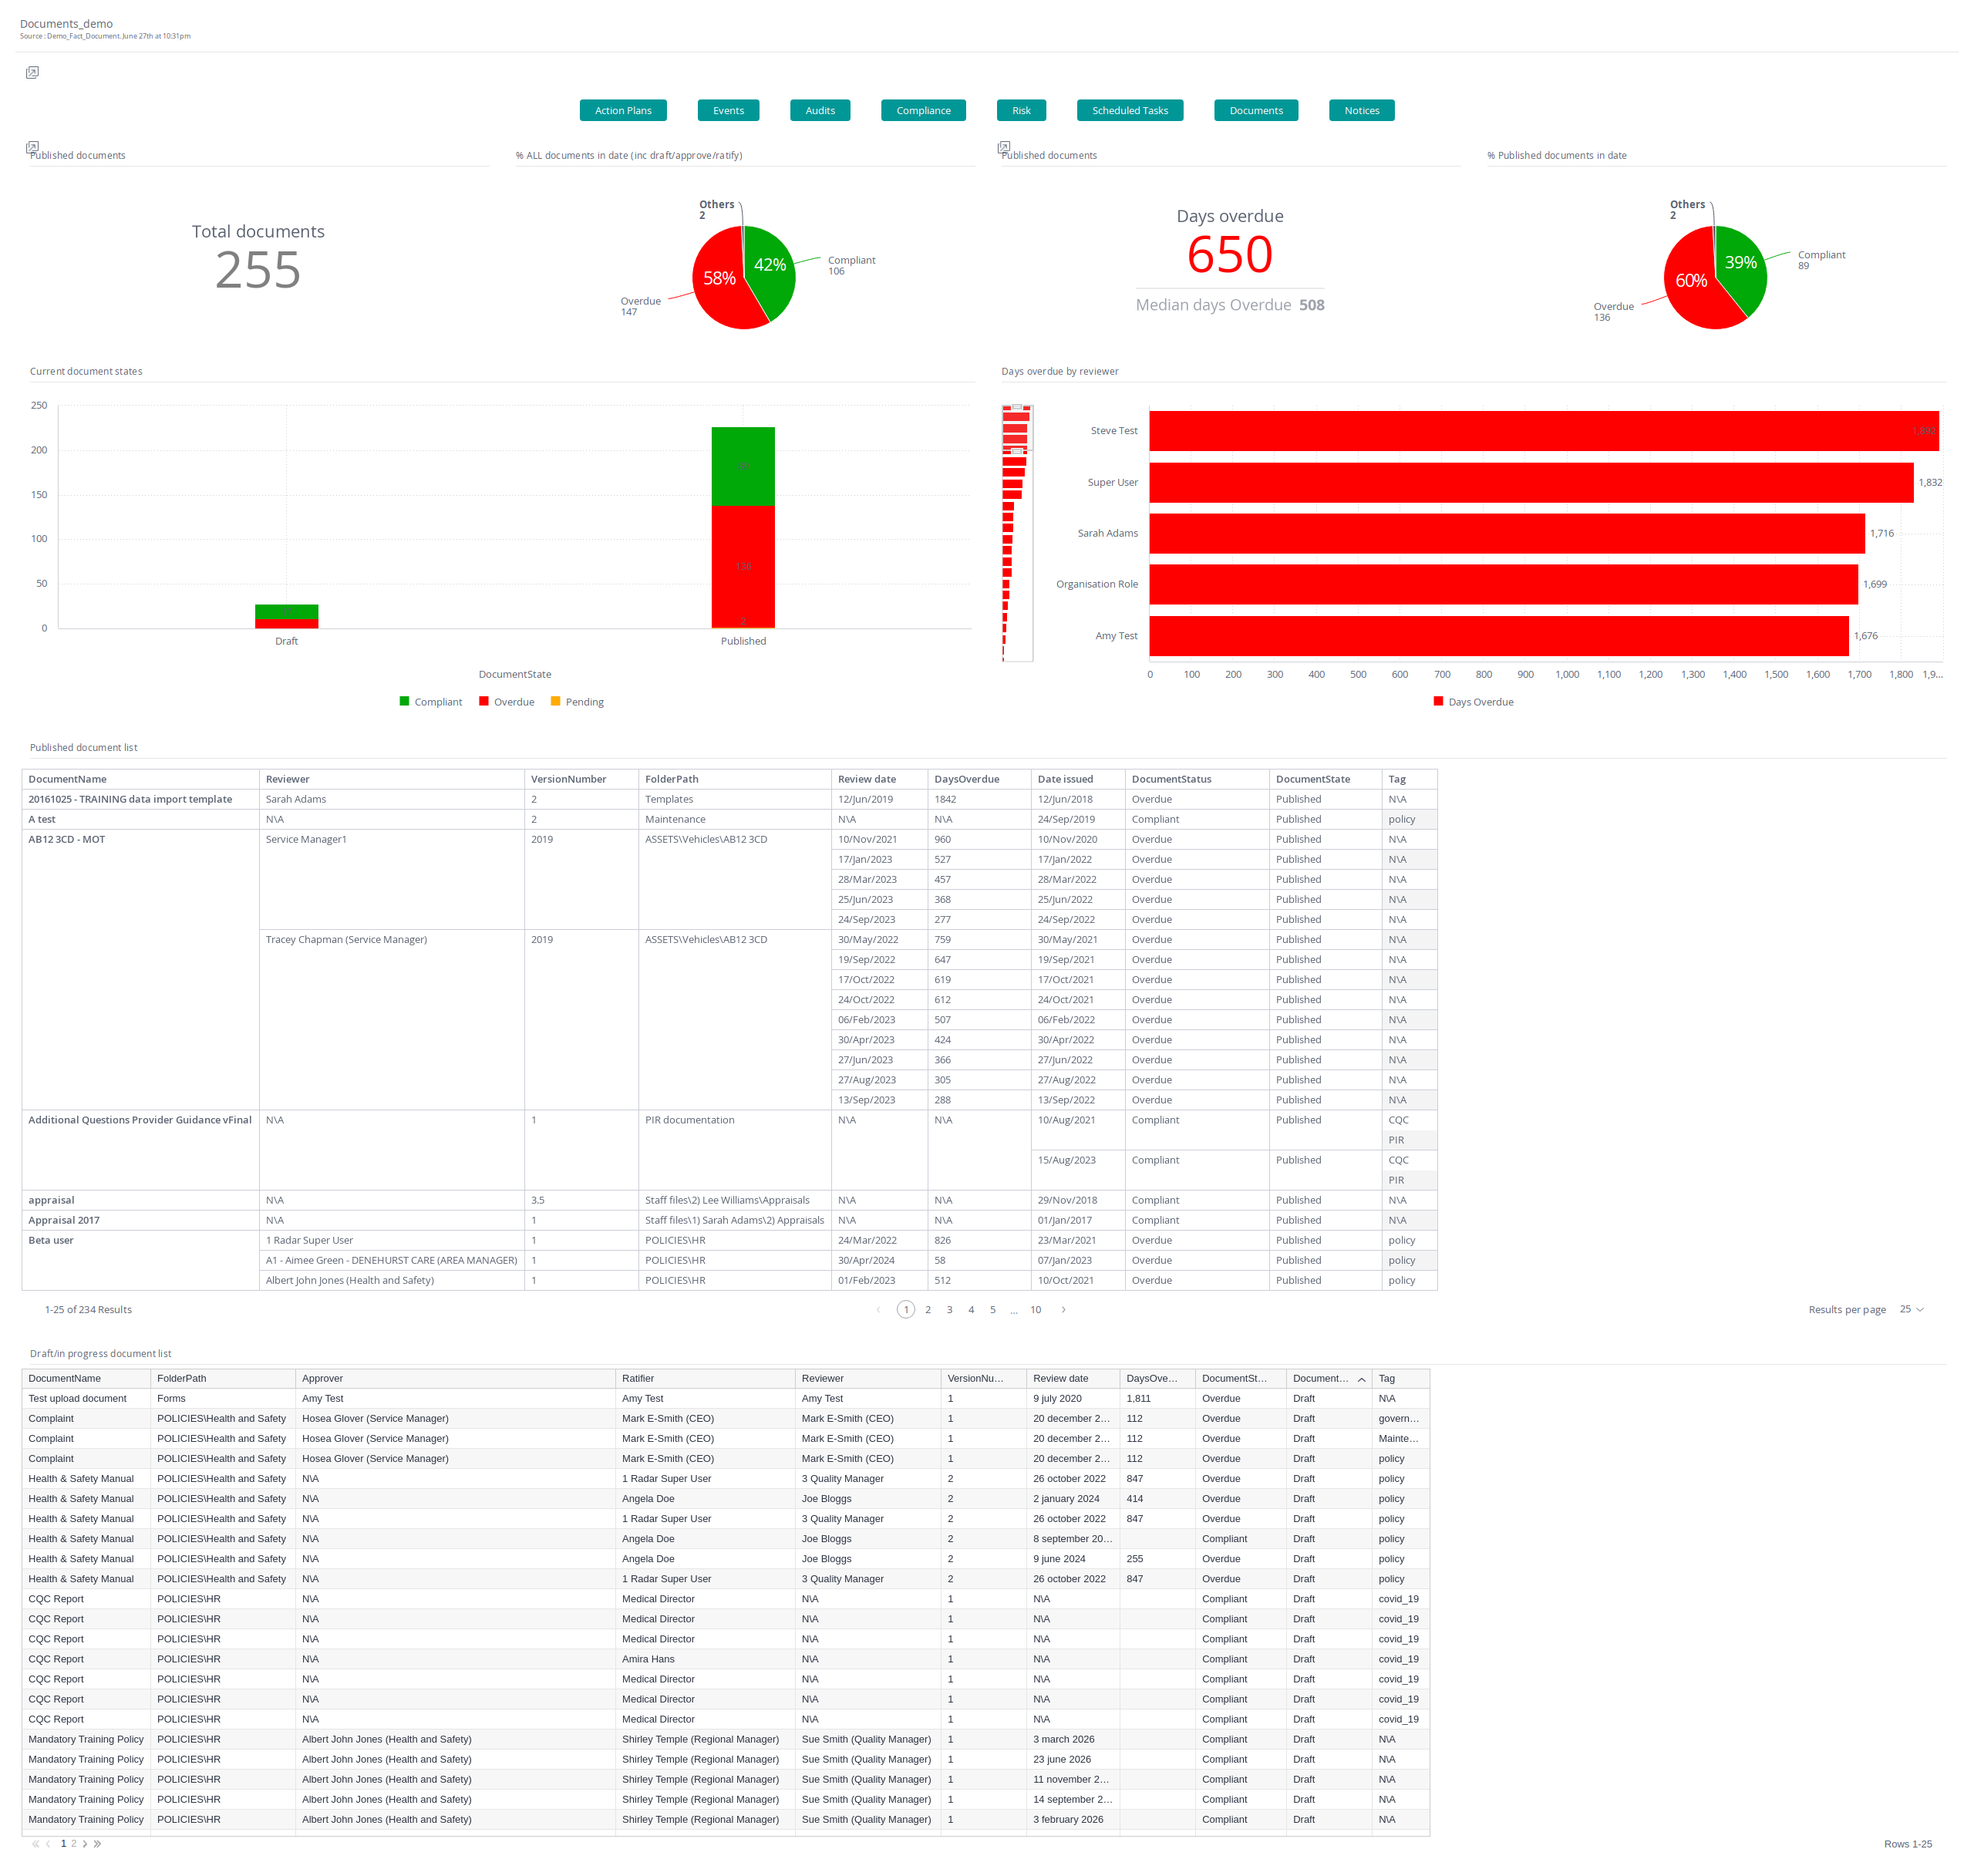
| Documents | This is your core overview of your documents. Data includes; % of documents in date, the number of documents with an overdue status, the number of documents split by status, and more. Use this dashboard to monitor document compliance statuses and keep on top of document reviews. |
Event Dashboards
| Dashboard Names | Description |
|---|---|
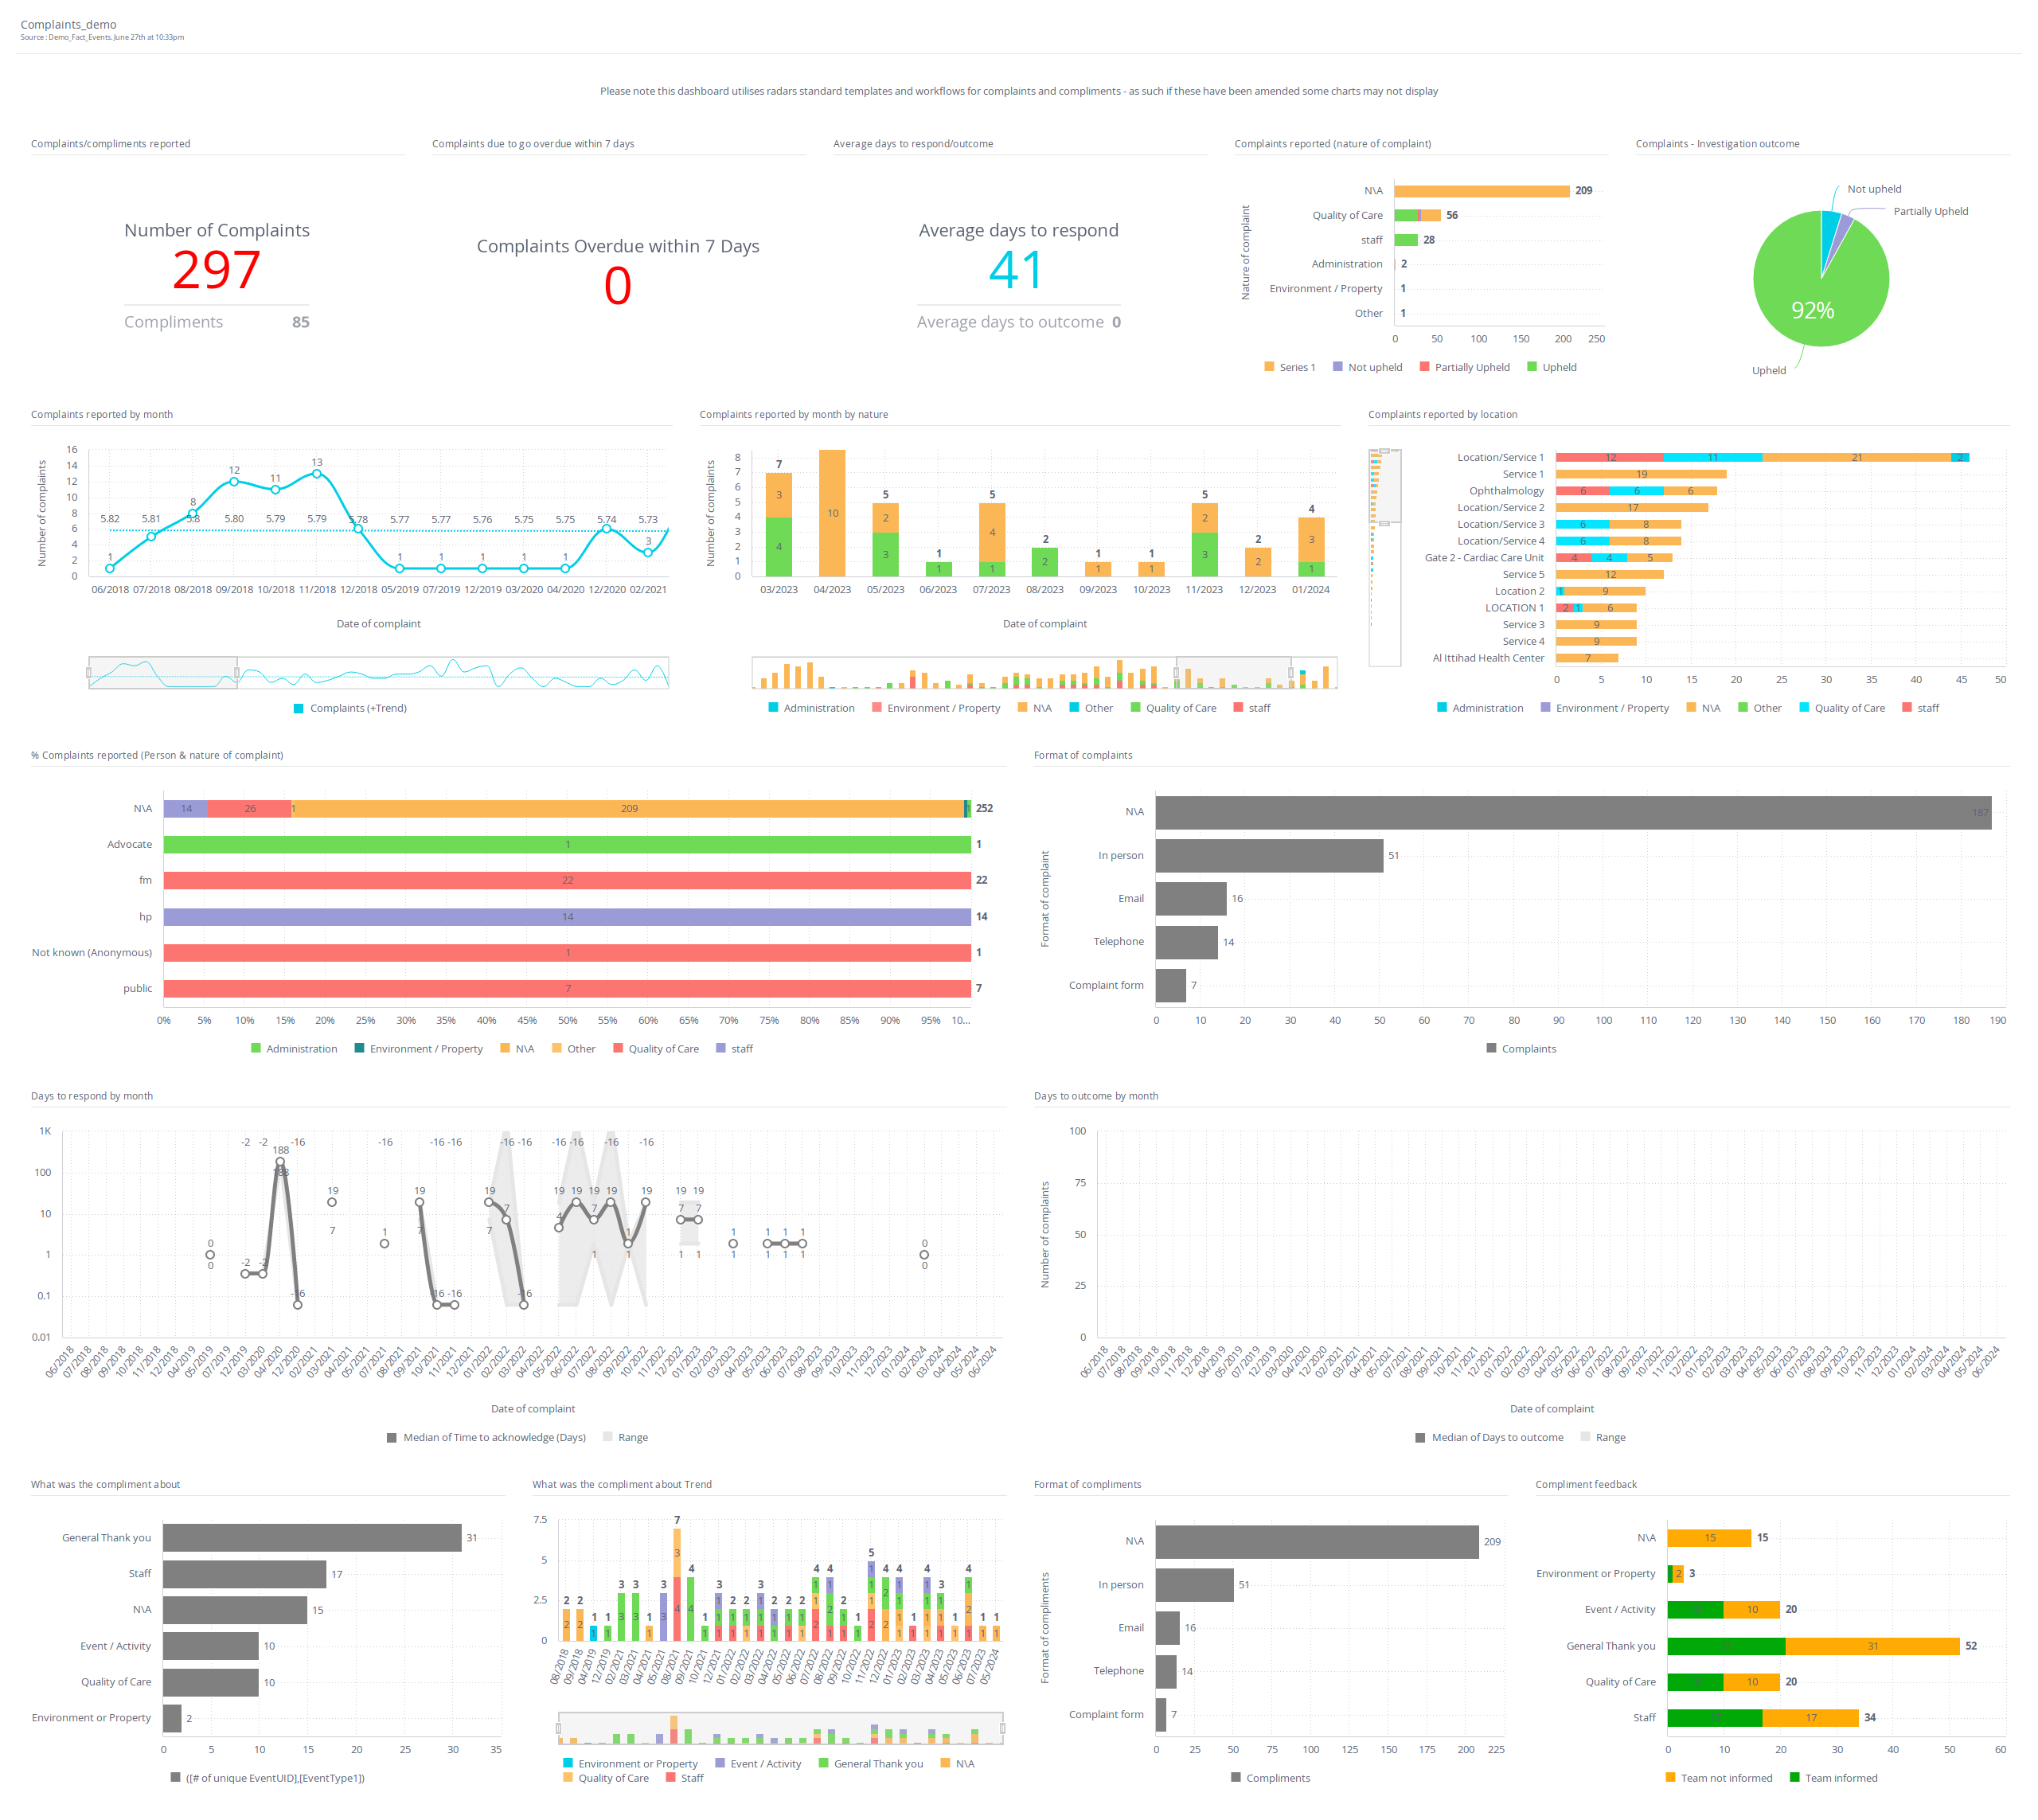
| Complaints | If you are using the Complaints toolkit event from Radar Healthcare, you can use this dashboard. Examples of data include number of complaints, nature of complaint, outcome status, format, and more… Useful if using Radar Healthcare’s toolkit complaint event to track key metrics. |
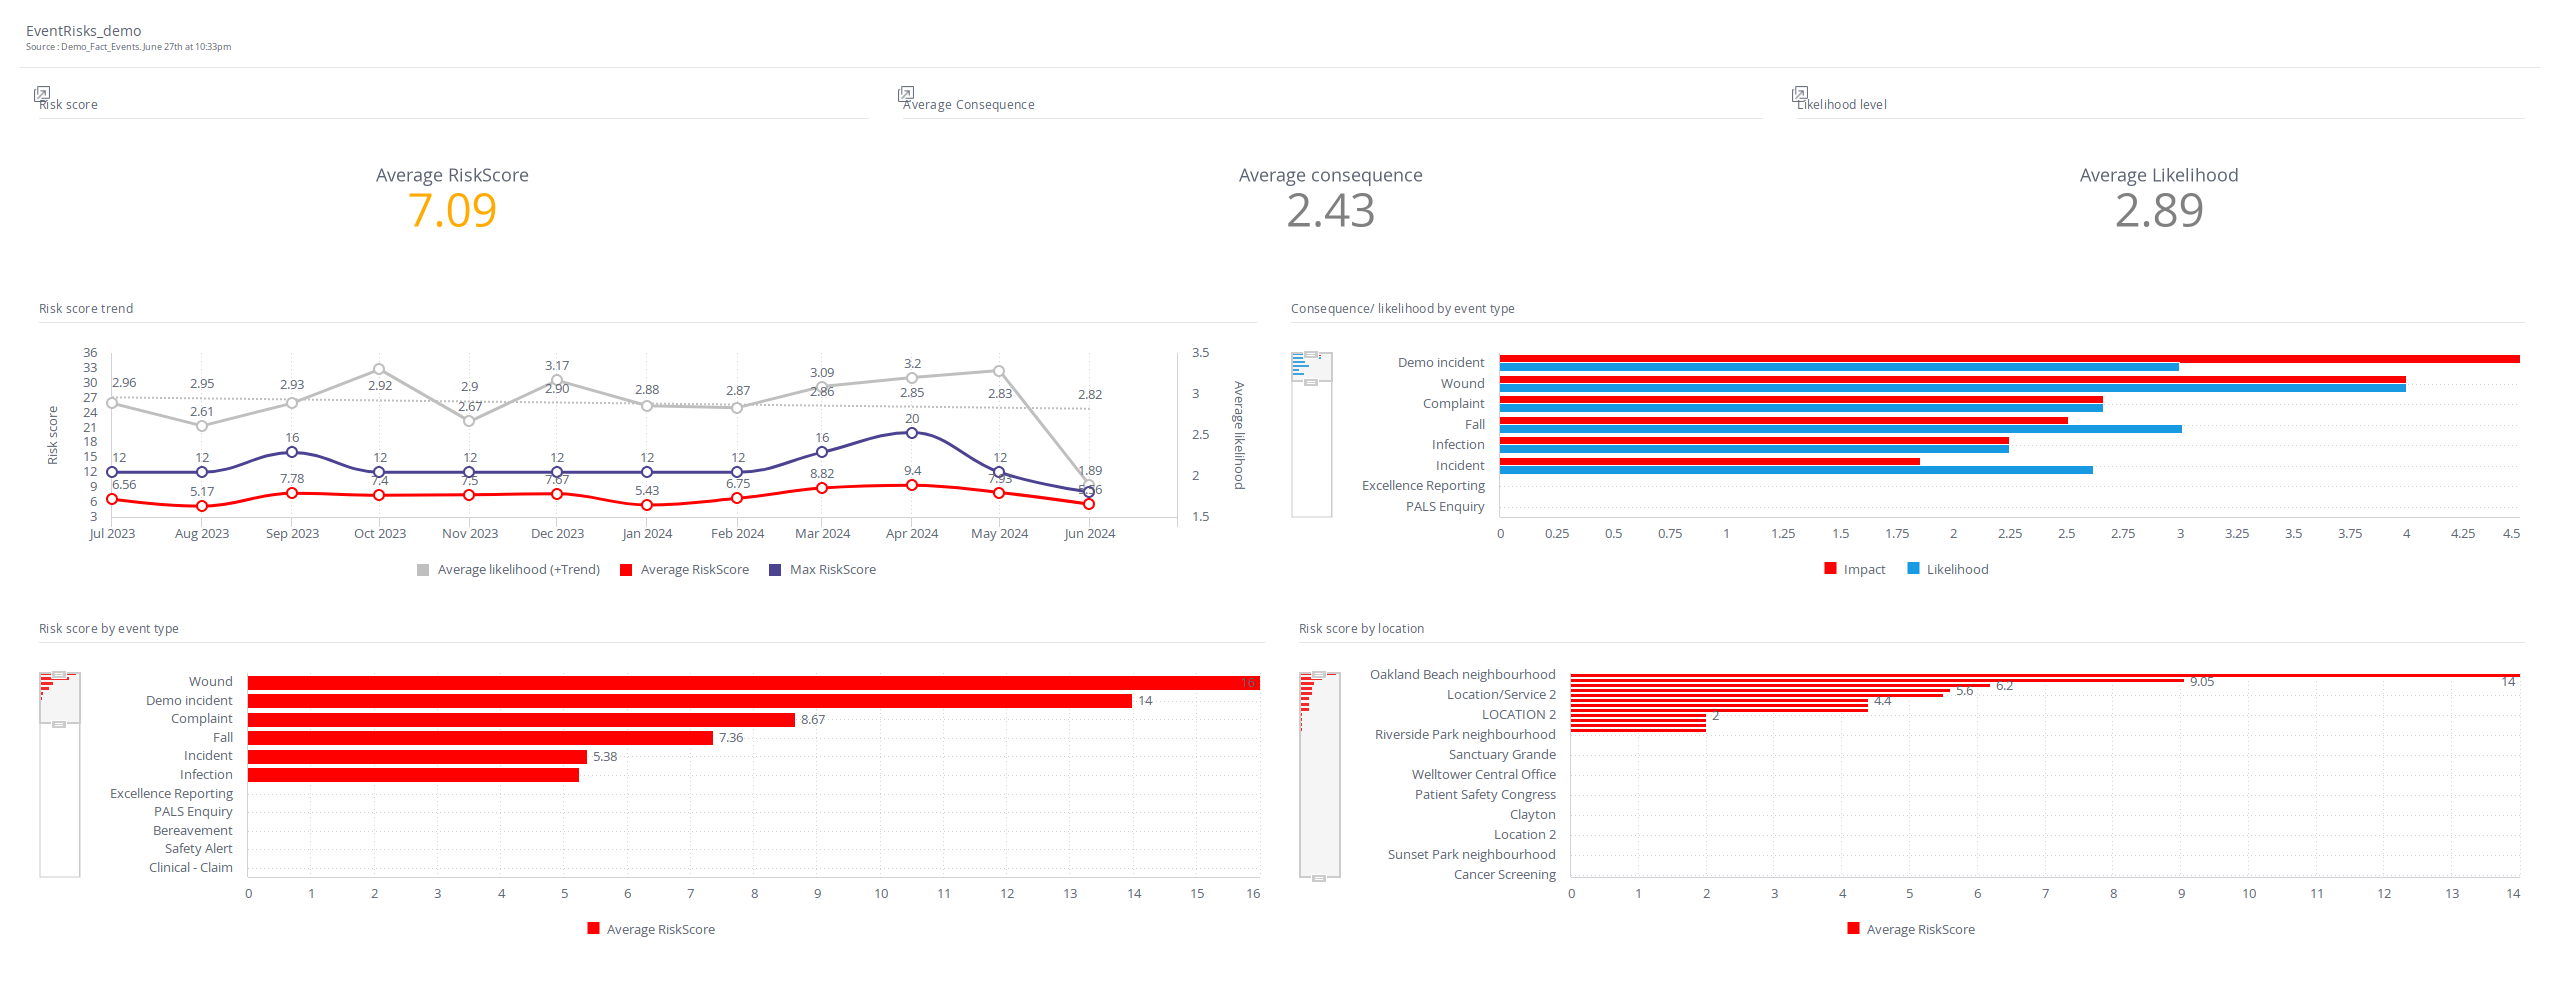
| EventRisks | This dashboard provides you with an overview of event risk scores. Data includes average risk score across events, average consequence, and likelihood, by type, by location (and more). Use this dashboard to identify highest risk events and track event risks over time. |
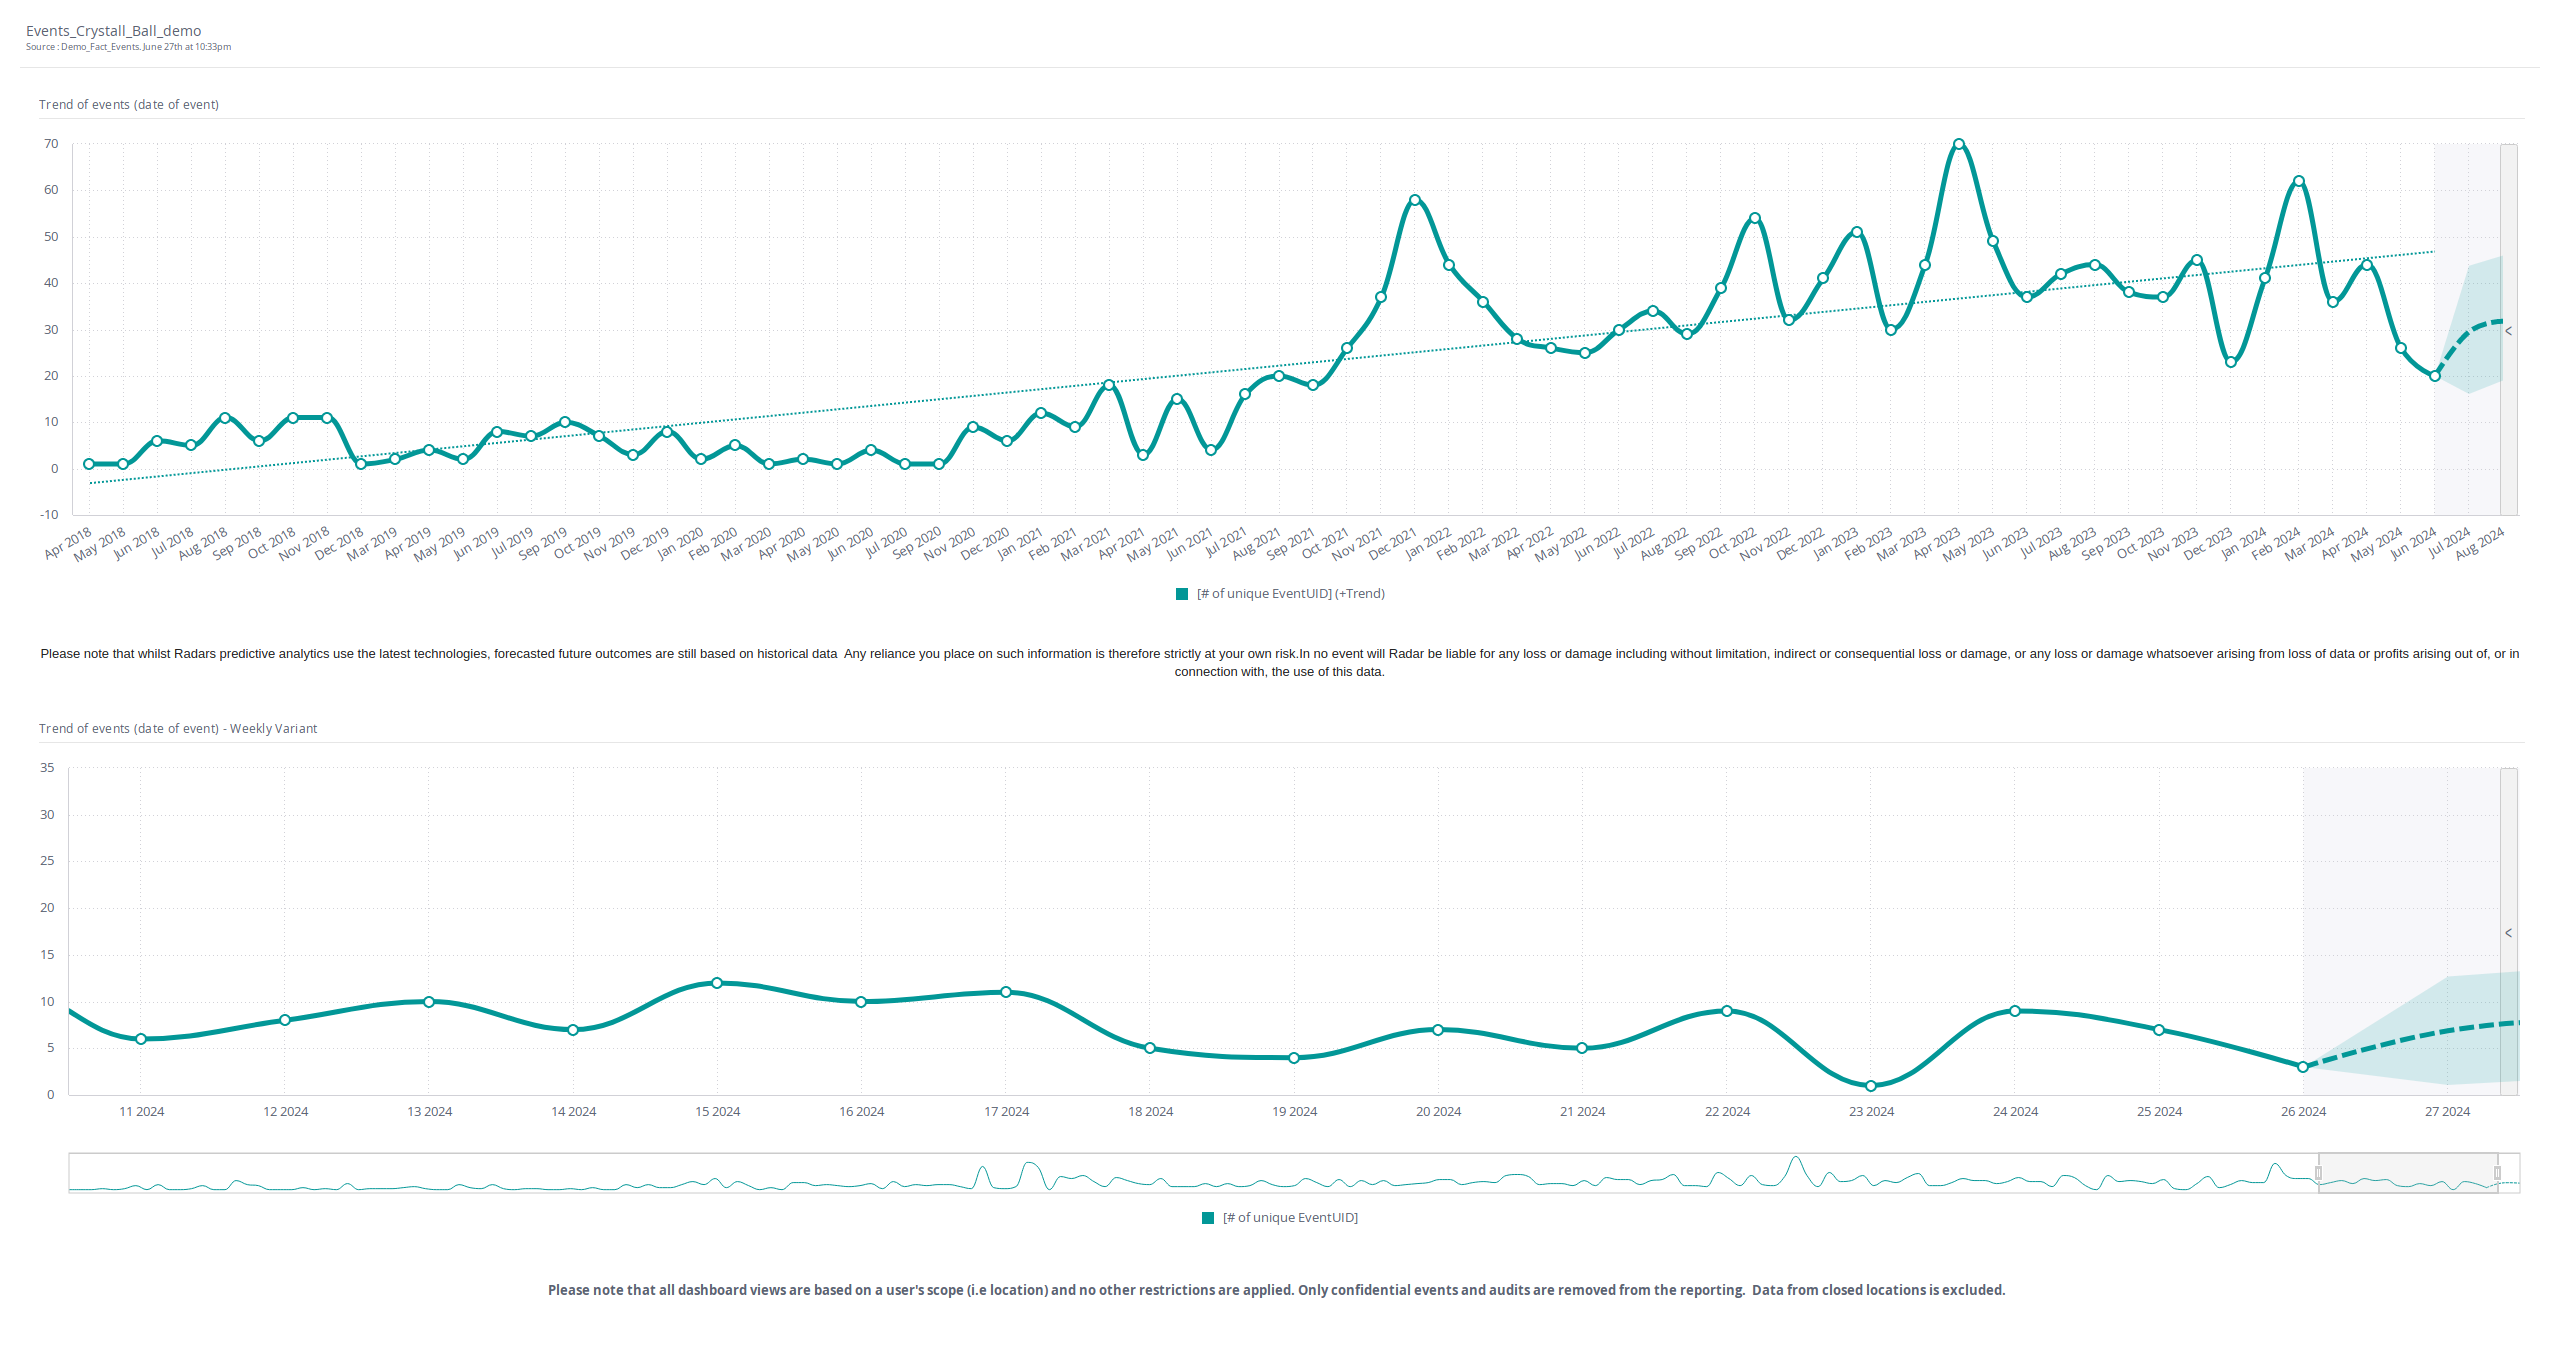
| Events_Crystal_Ball | Forecast future event reporting using your existing data in your system. This requires a minimum of 3 months data before using |
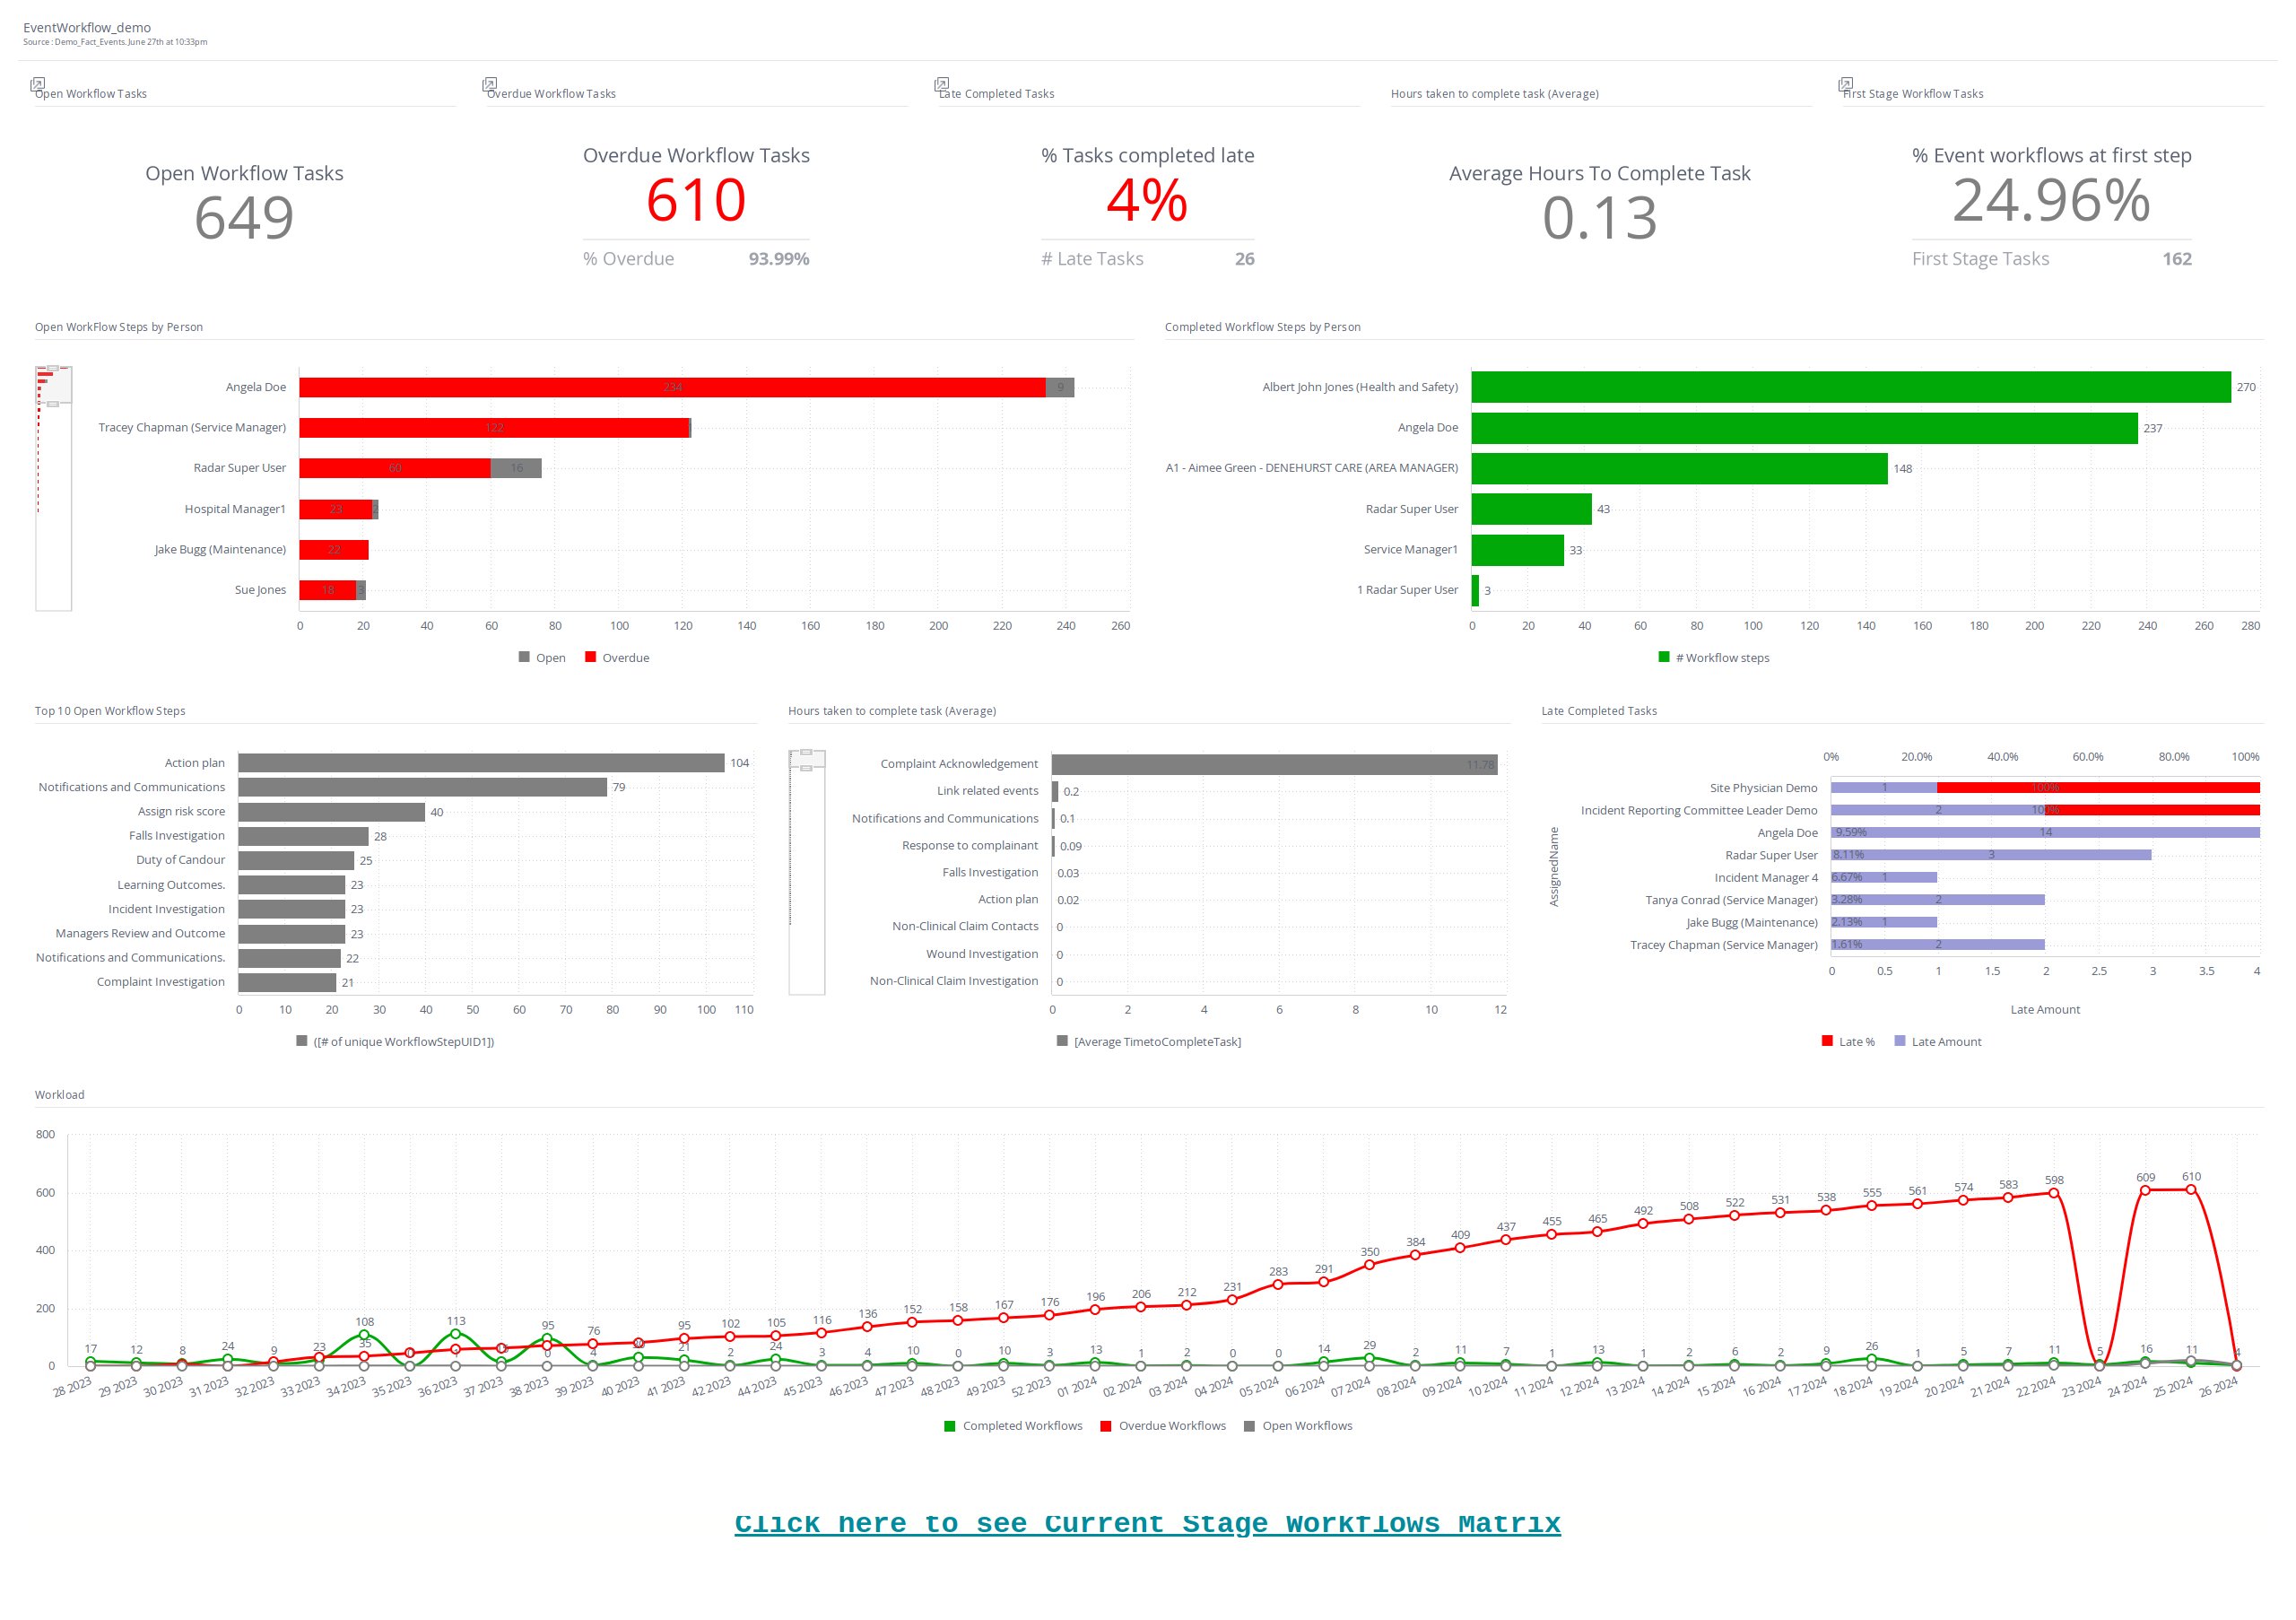
| EventWorkflow | This is your core overview of your Event Workflow Tasks. This dashboard allows you to view the number of workflow steps open and overdue. See the spread of workflows by user, the top 10 open workflows steps, time to complete workflow steps, and a detailed matrix of workflow steps, their status and who they are assigned to. Track how efficient your event workflows are and which workflow tasks take the most amount of time to complete or most often go overdue. Get oversight of team workloads and keep on top of overdue tasks. |
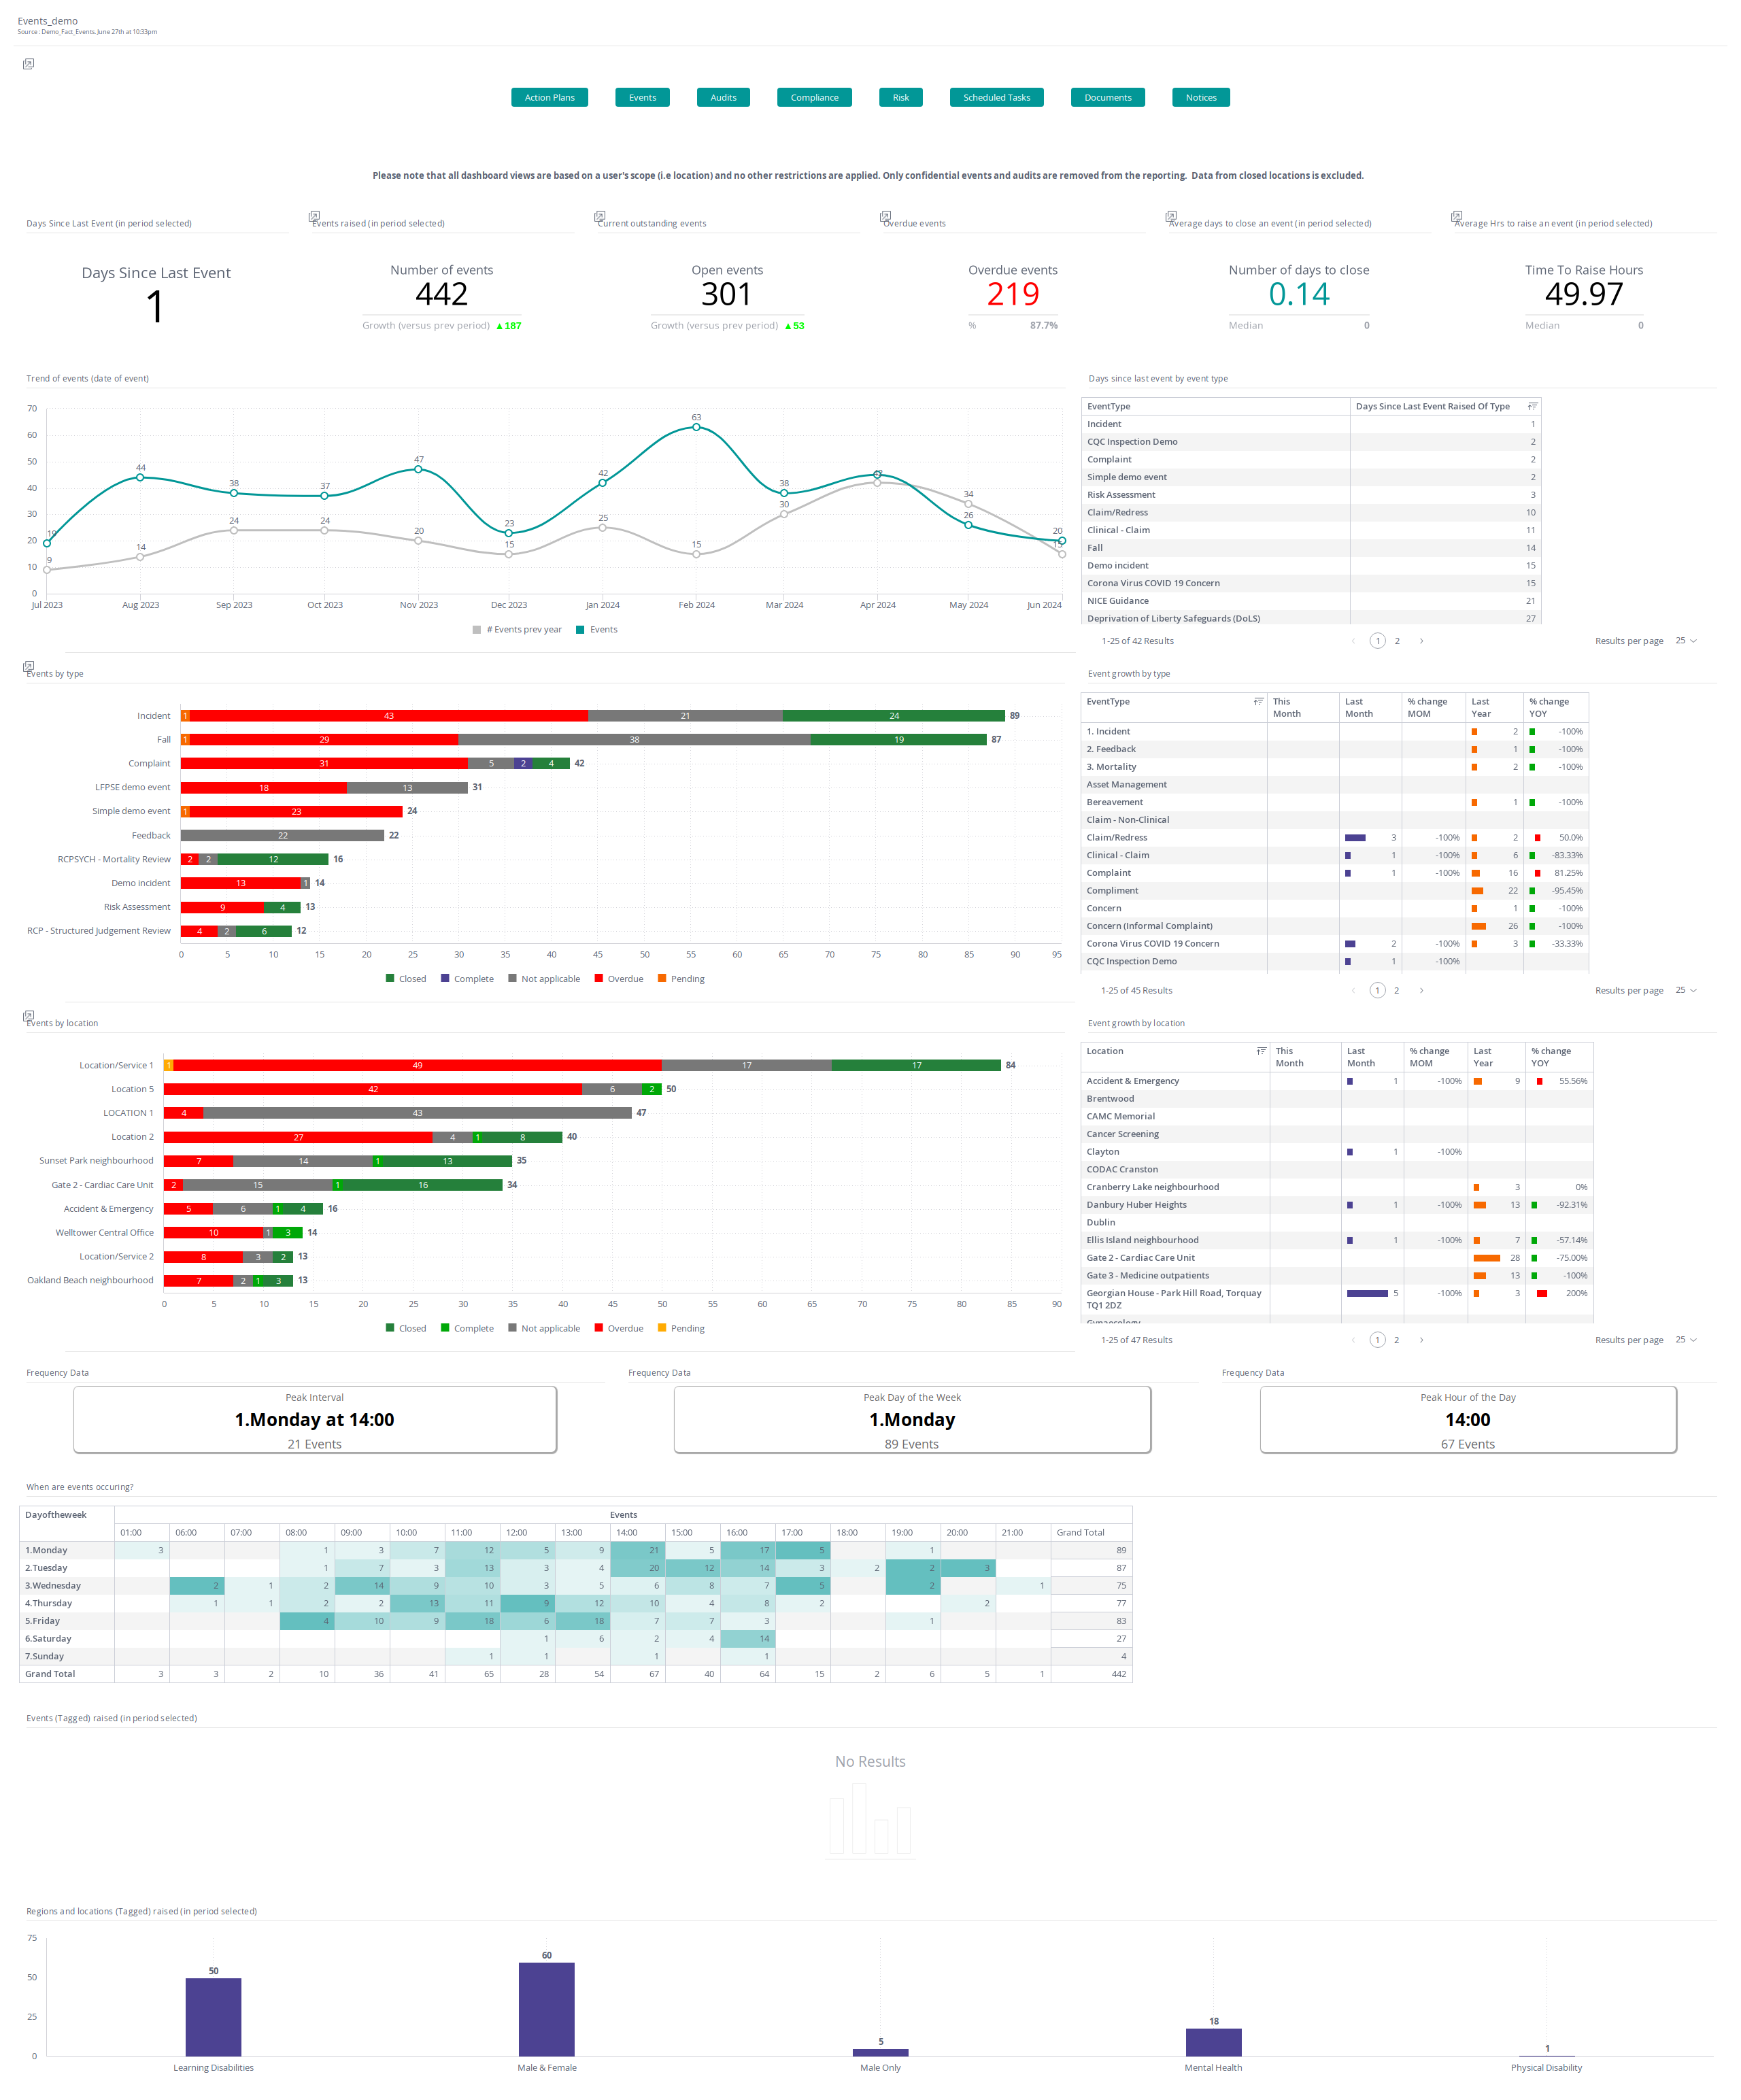
| Events | This is your core overview of events. Including the number of events raised in a given time period by type of event, the number of open/overdue events, the trend of events, when and where are they occurring, and lots more. This dashboard accounts for a user's scope (i.e location). Confidential events and closed locations are not included. Use this dashboard to keep on top of overdue events and track your teams’ engagement with events. |
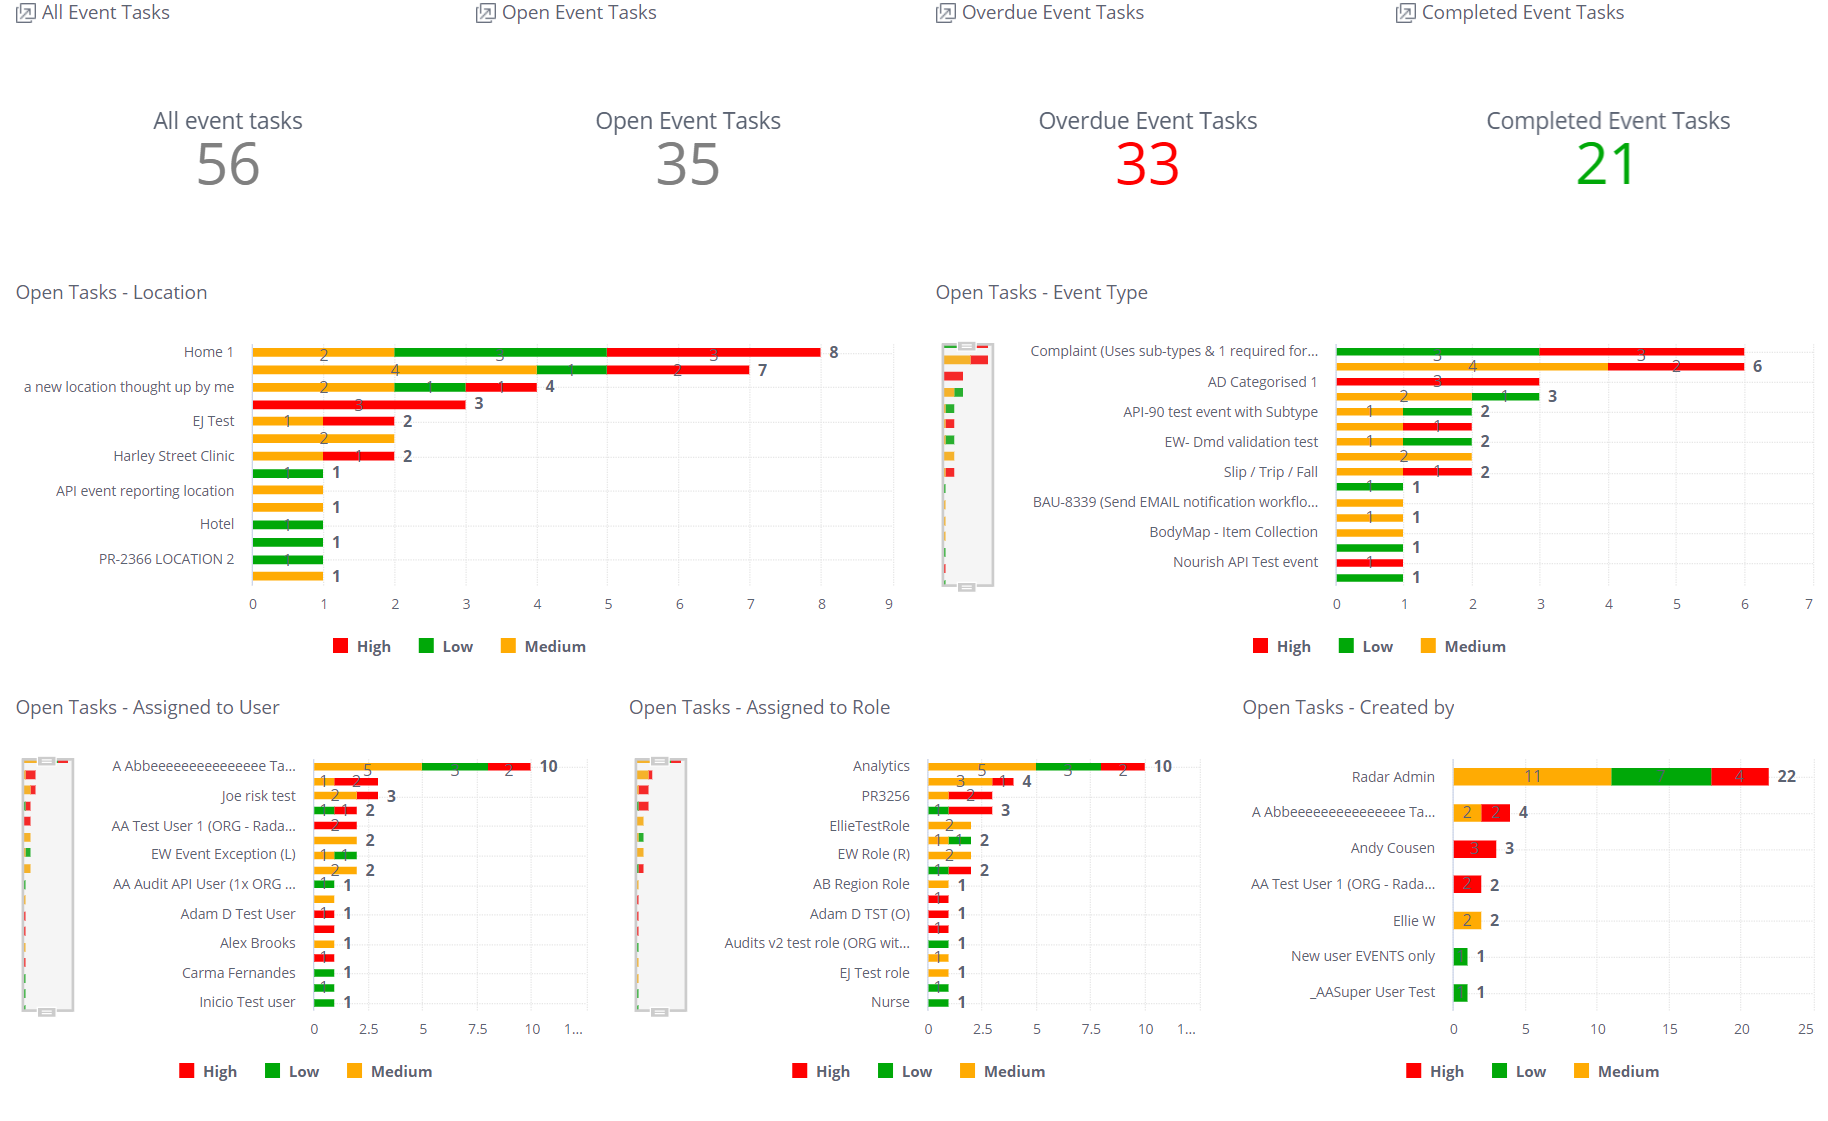
| EventTasks | This dashboards provides an overview of event tasks in your system. Use this dashboard to keep on top of overdue event tasks and monitor staff workloads. |
| Falls | If you are using the Falls toolkit event from Radar Healthcare, you can use this dashboard. Examples of data include number of falls, injuries sustained, types of falls by number, by location and type, affected residents and repeat falls by resident, and more… Useful if using Radar’s toolkit falls event to track key metrics. |

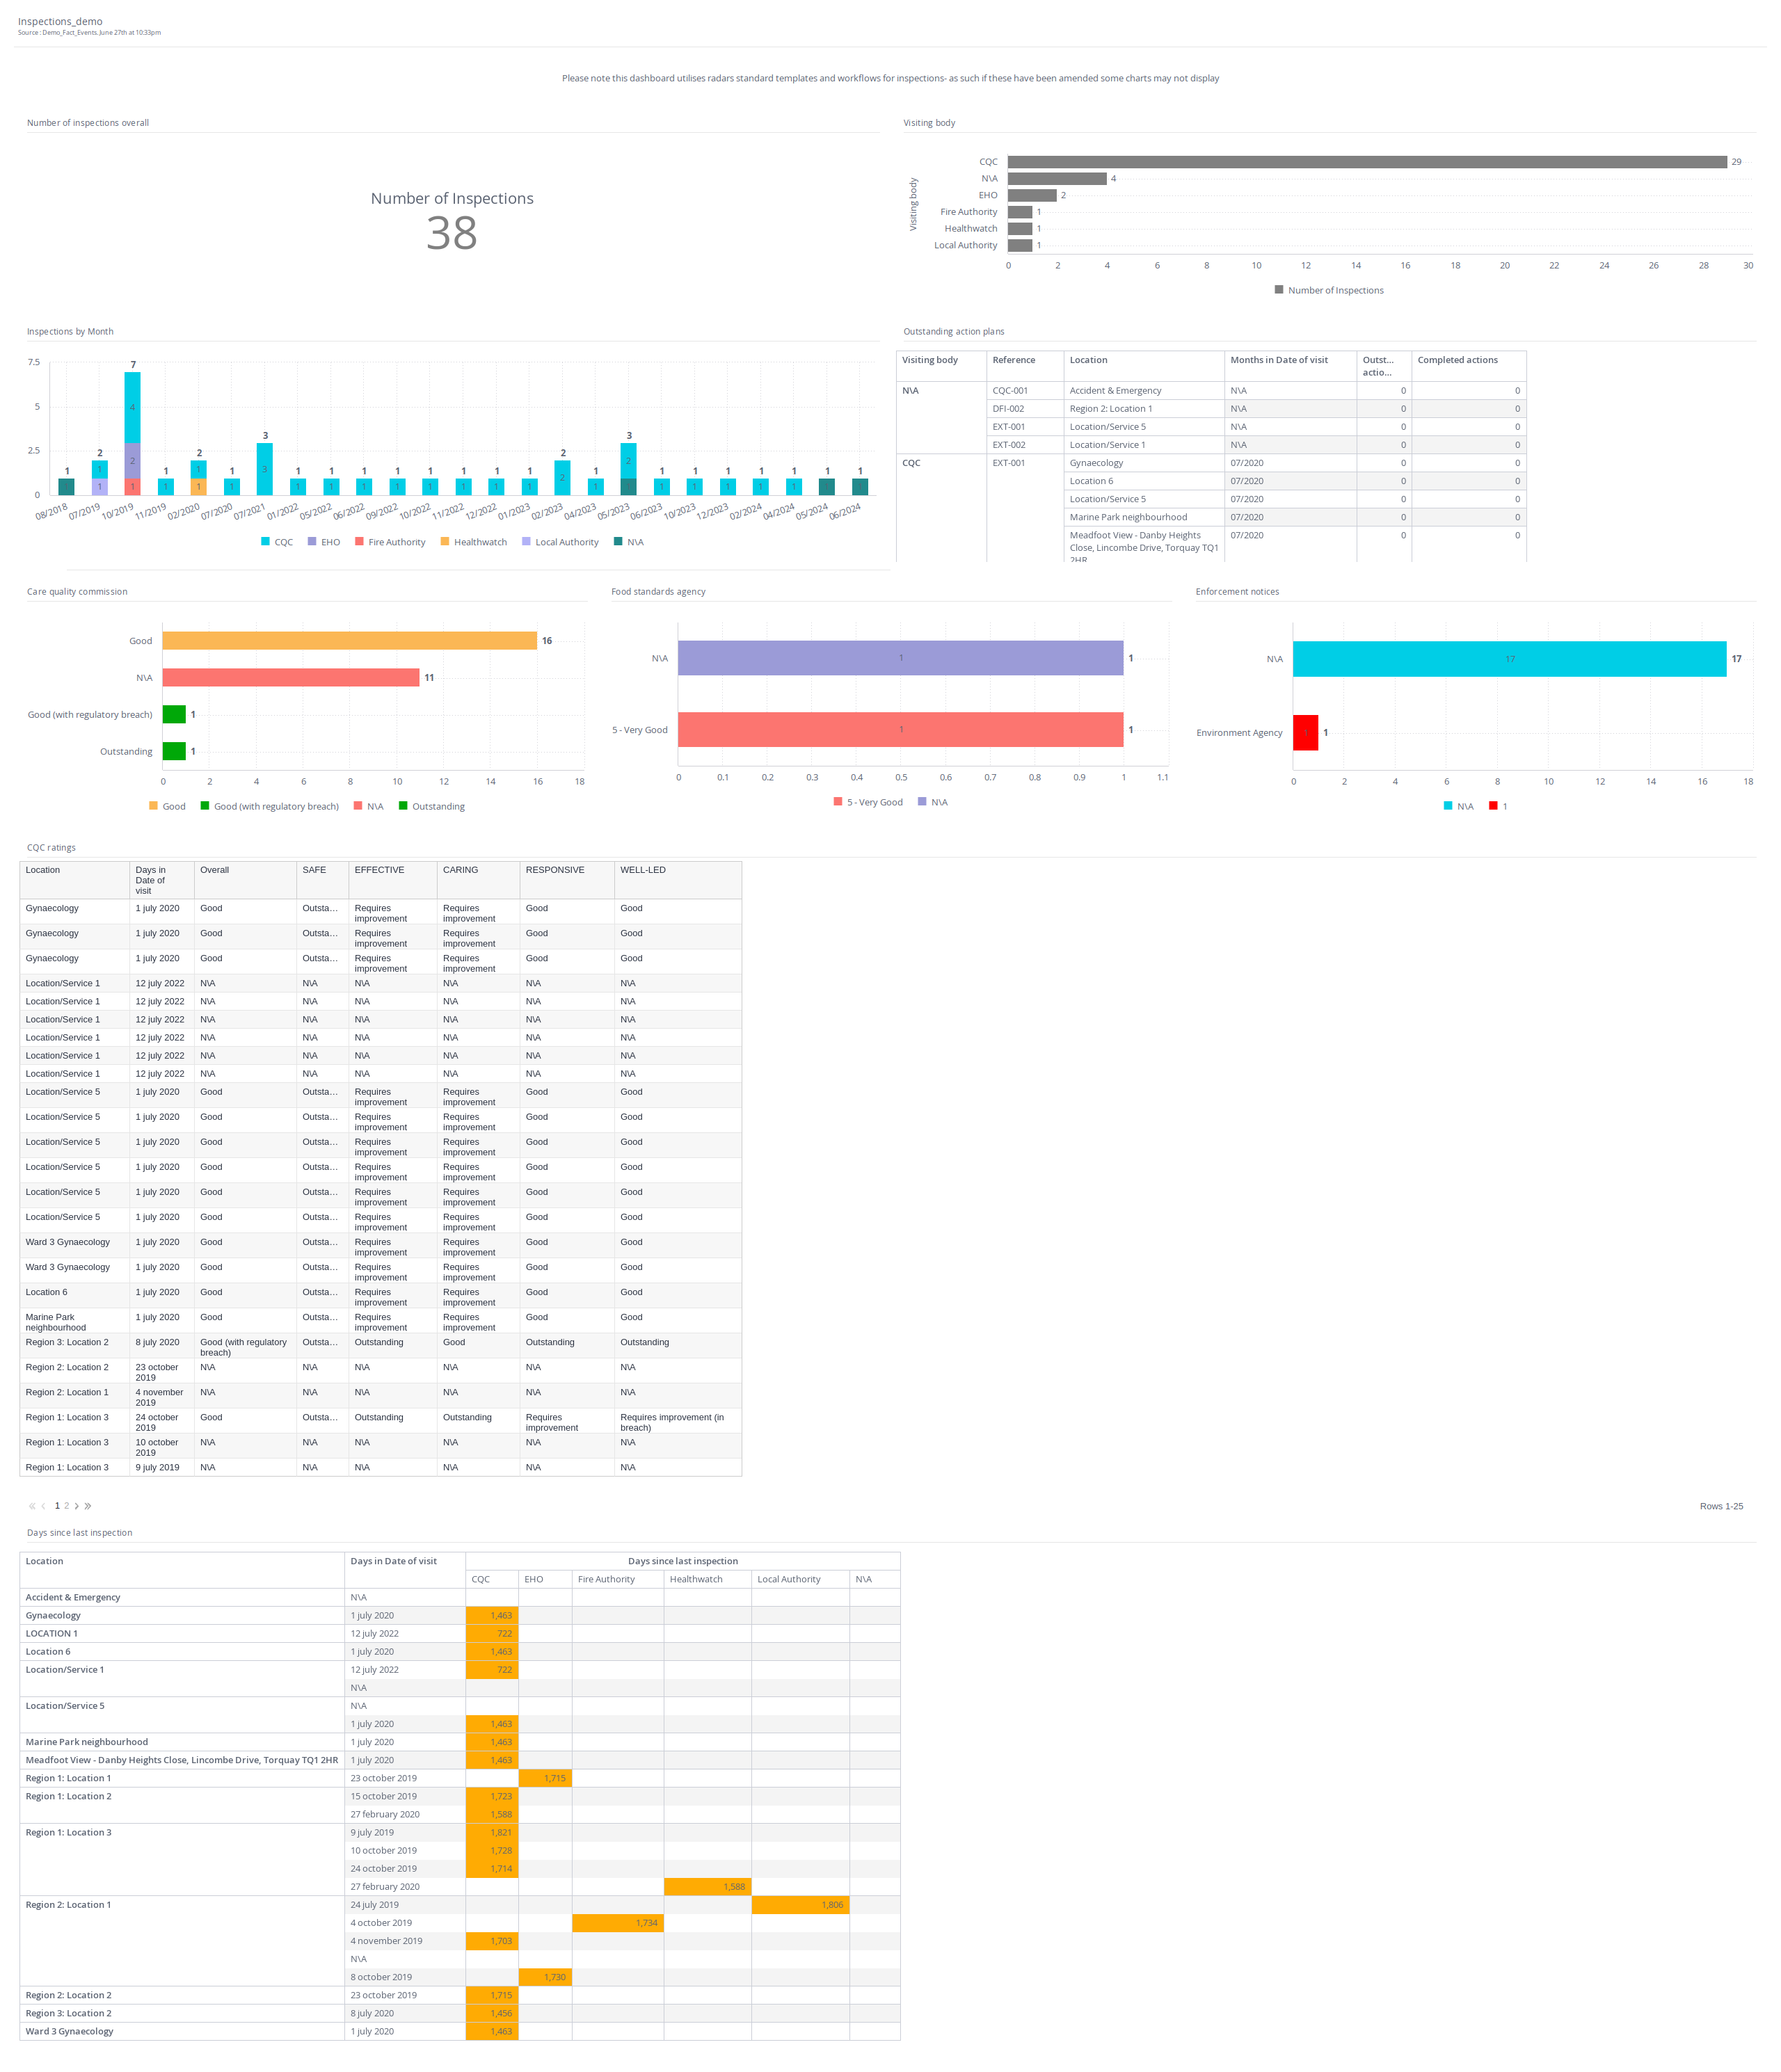
| Inspections | If you are using the Inspection toolkit event from Radar Healthcare, you can use this dashboard. Examples of data include the number of inspections, by visiting body, by month, how many outstanding action plans, and more… Useful if using Radar’s toolkit inspections event to track key metrics. |
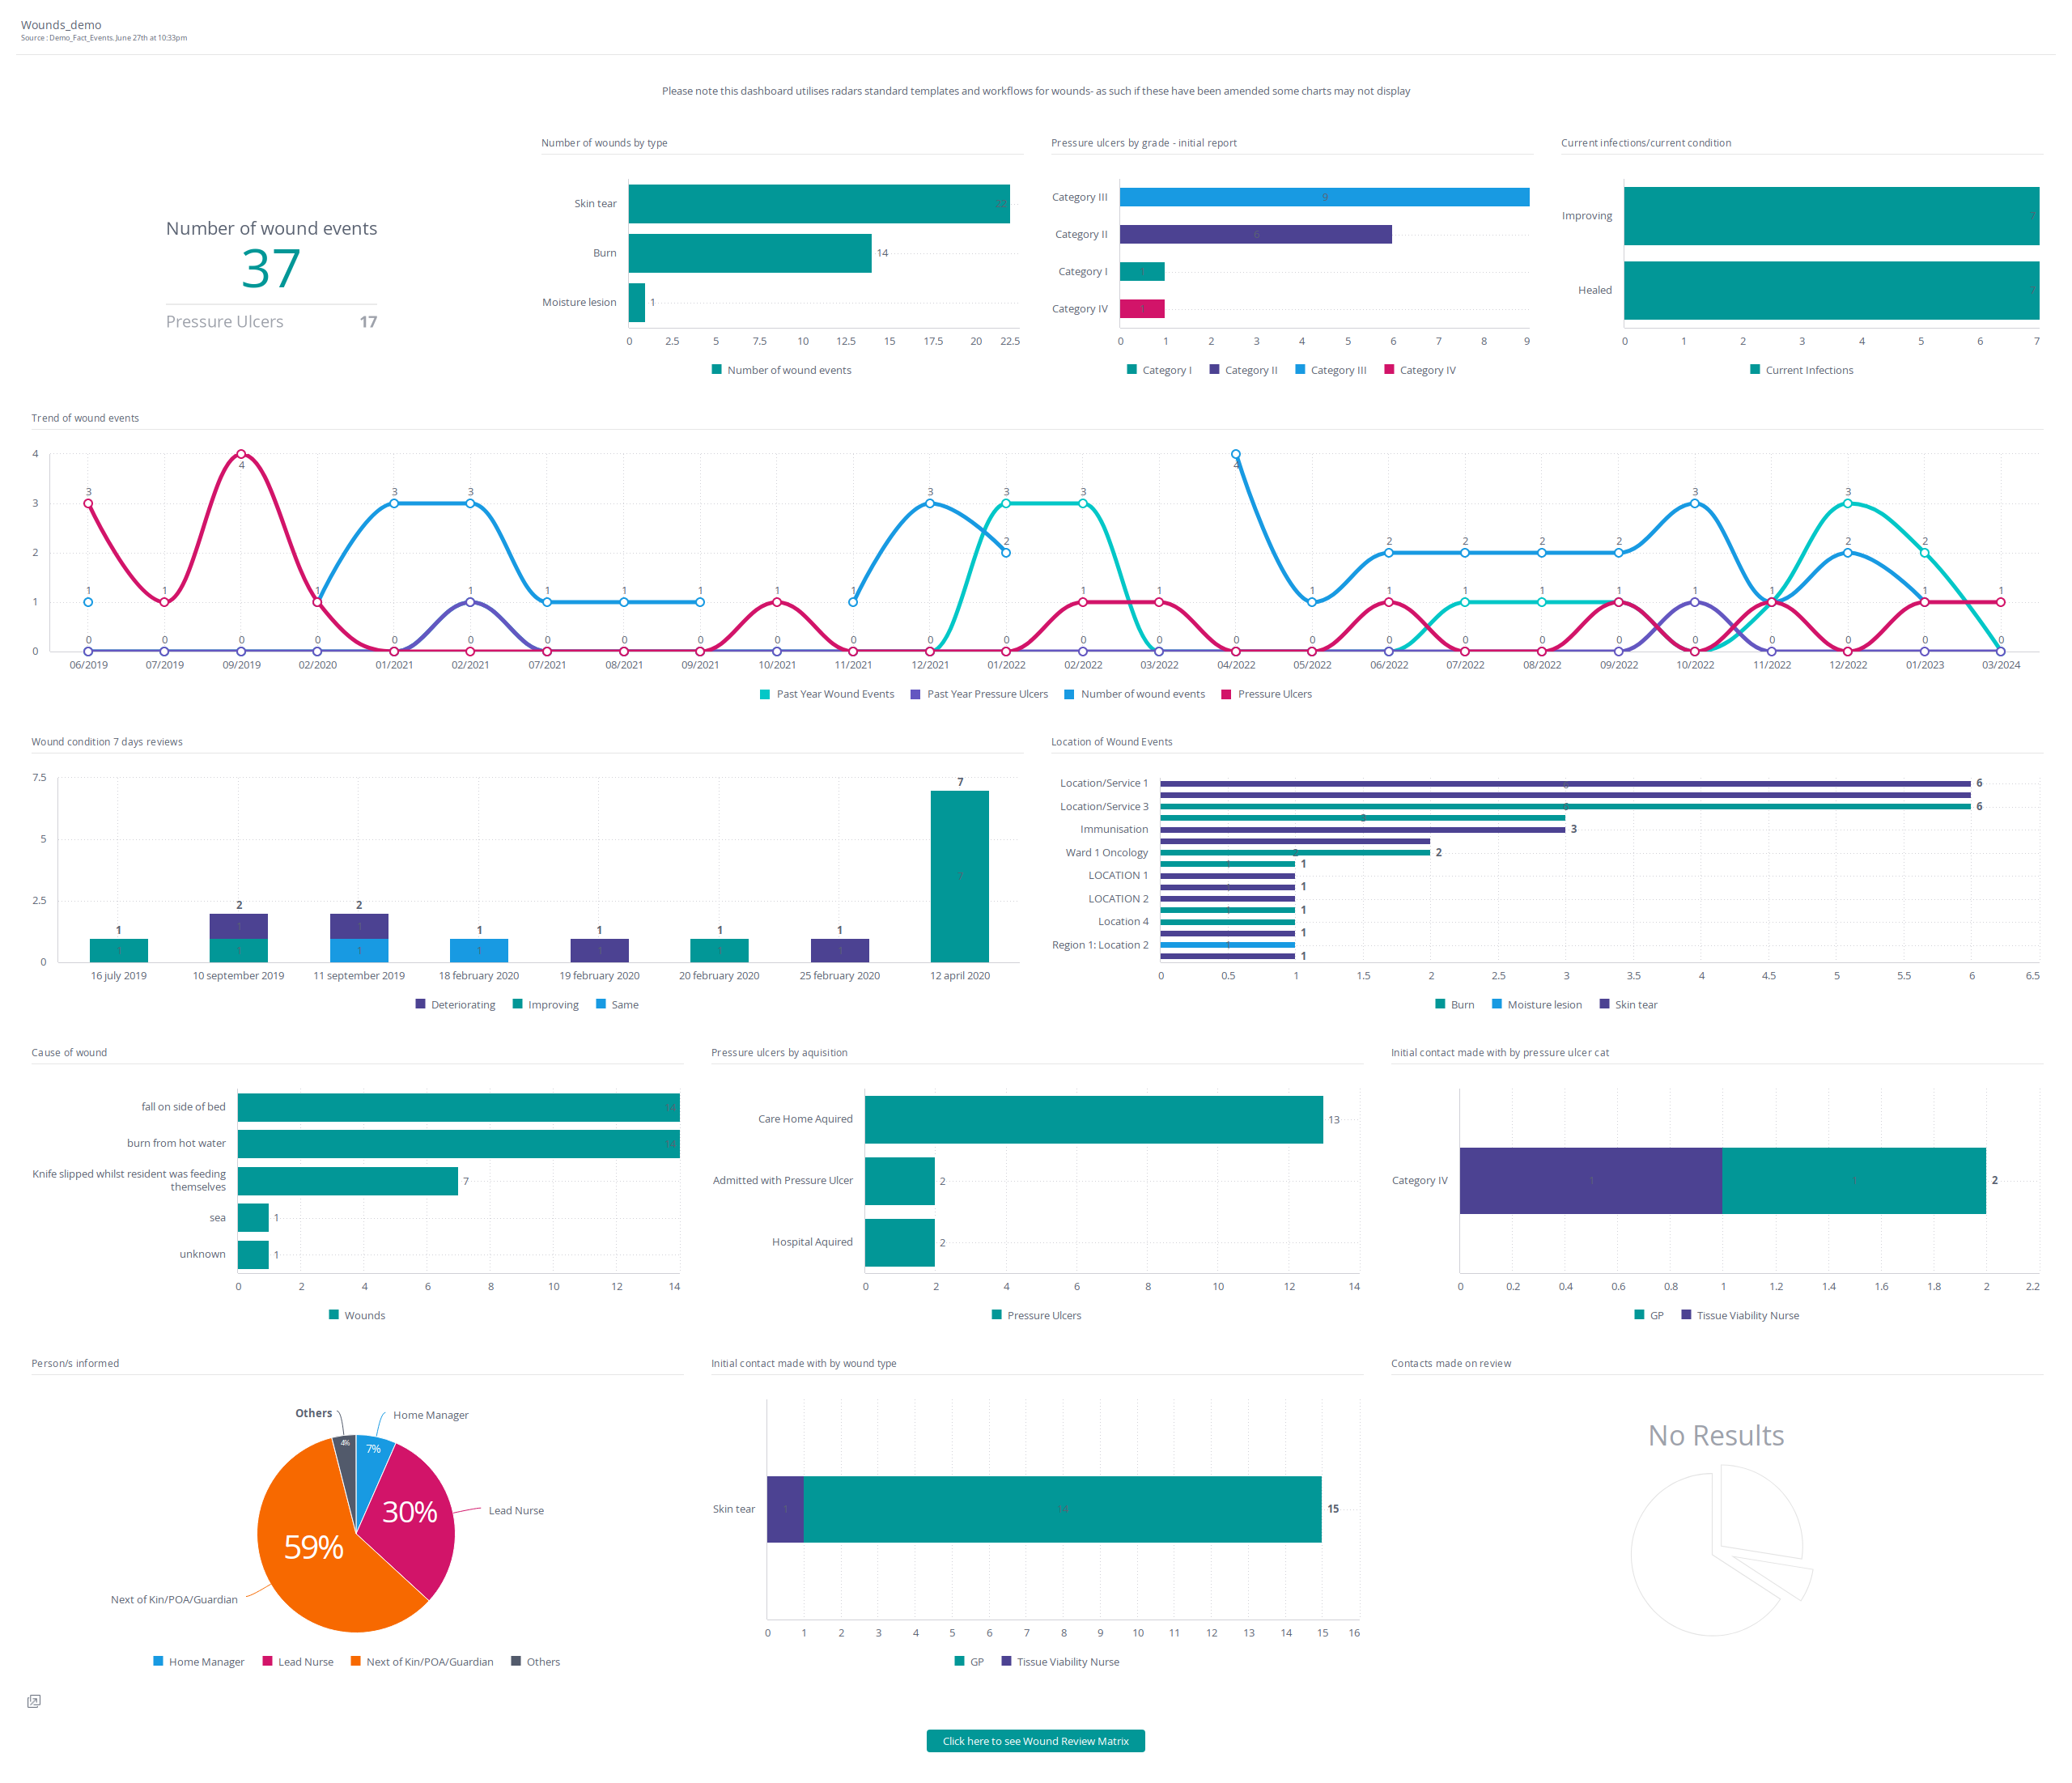
| Wounds | If you are using the Wounds toolkit event from Radar Healthcare, you can use this dashboard. Examples of data include number of wounds, number of pressure ulcer, current infection levels, trends over time, by cause of wound, by acquisition, by category, and more… Useful if using Radar’s toolkit wounds event to track key metrics. |
Notices Dashboards
| Dashboard Names | Description |
|---|---|
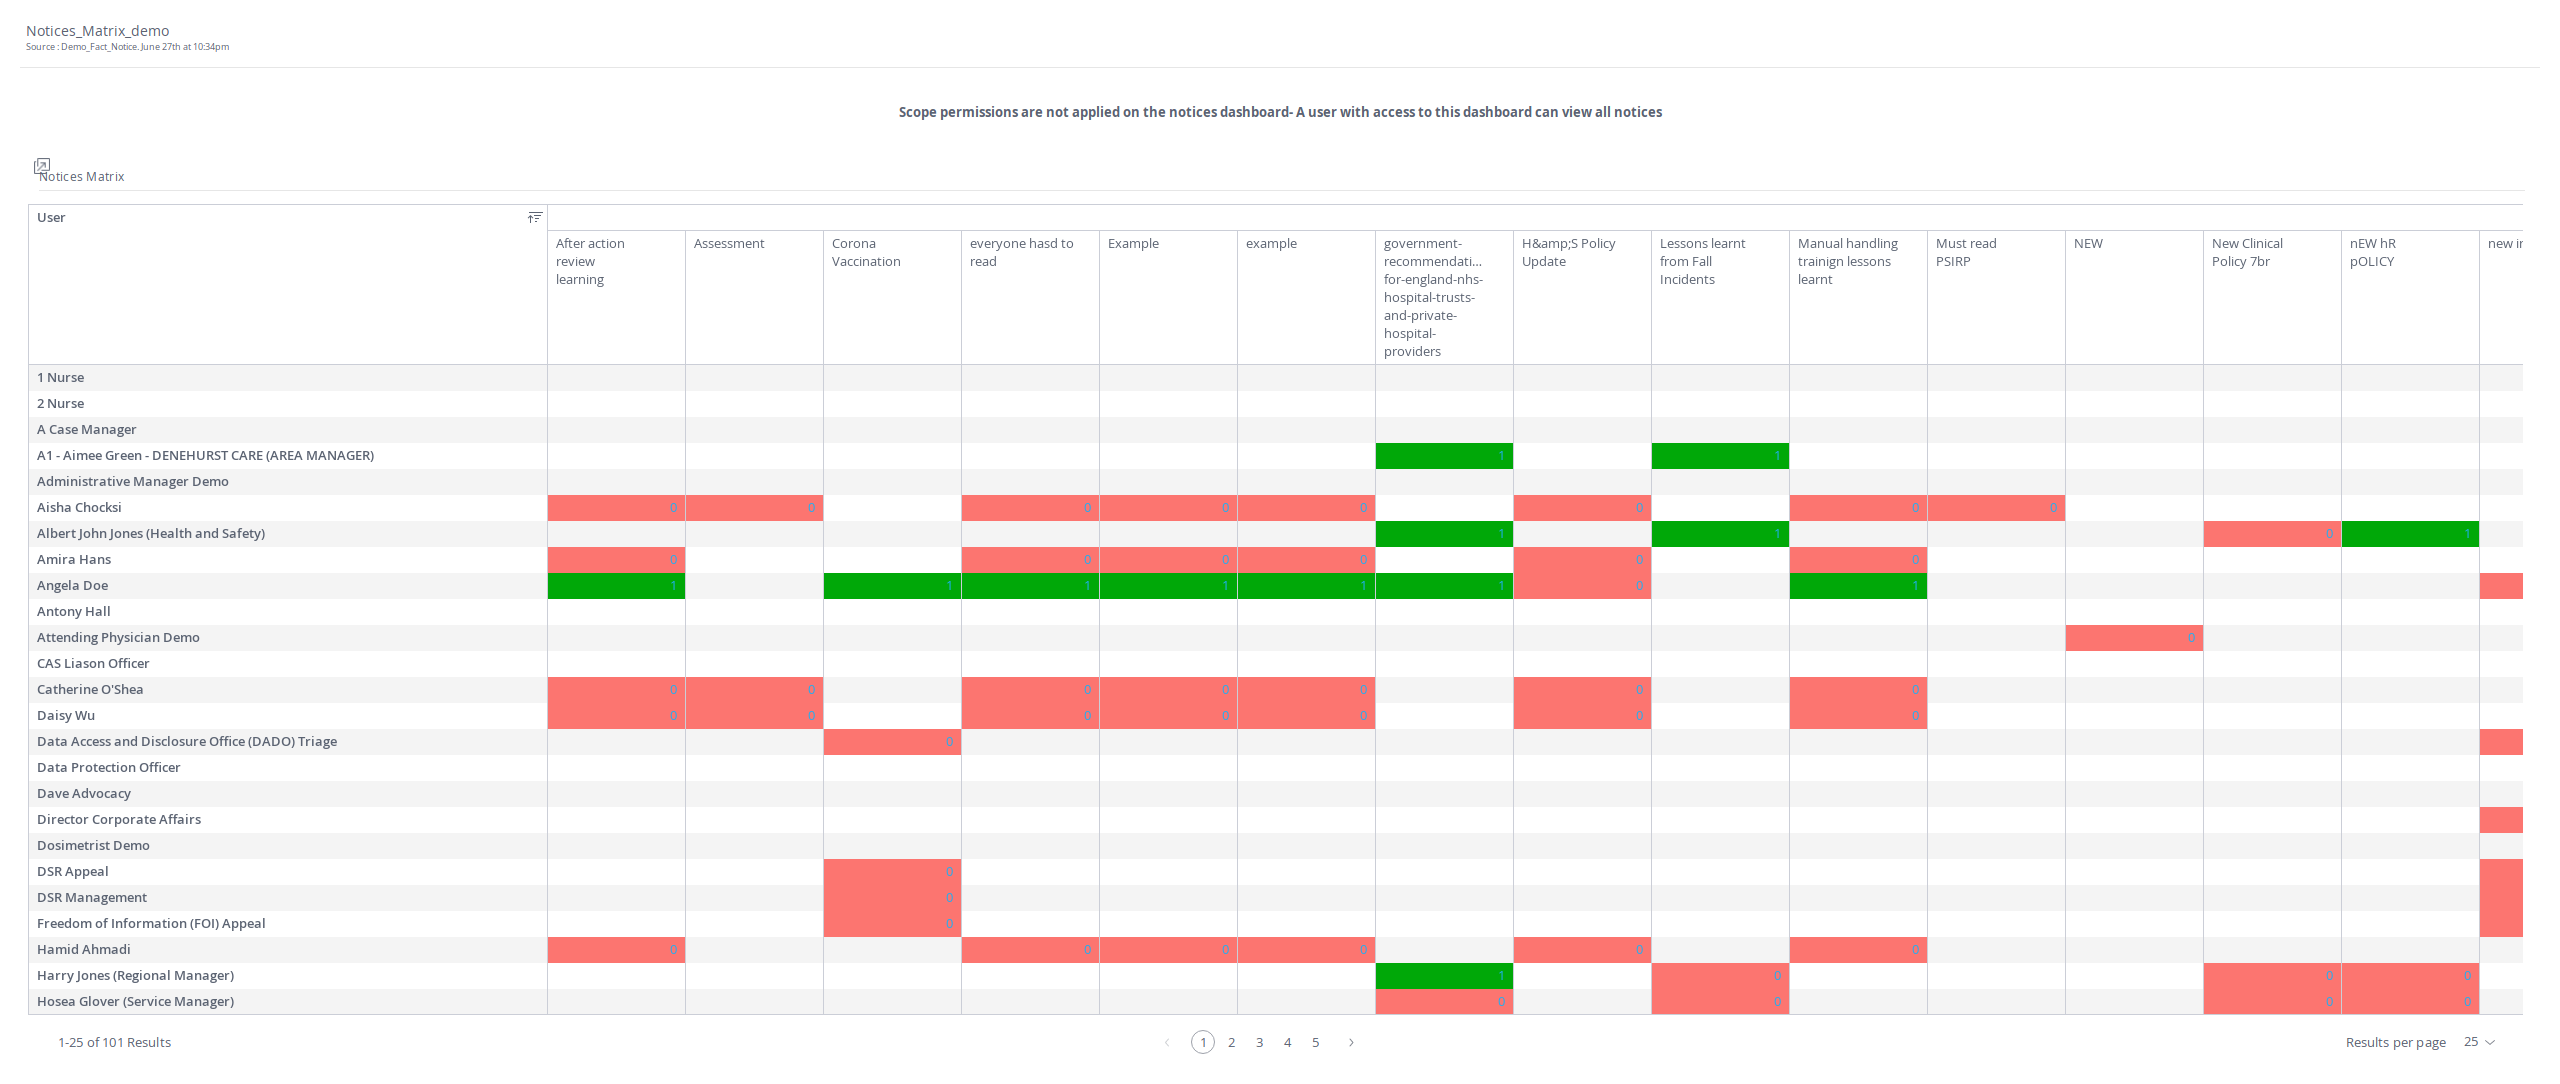
| Notices_Matrix | This dashboard shows a table of users and notices with a record of if the user has/hasn't confirmed a notice. Org, Region and Location scope permissions are not applied on the notice's dashboard - A user with access to this dashboard can view all notices. |
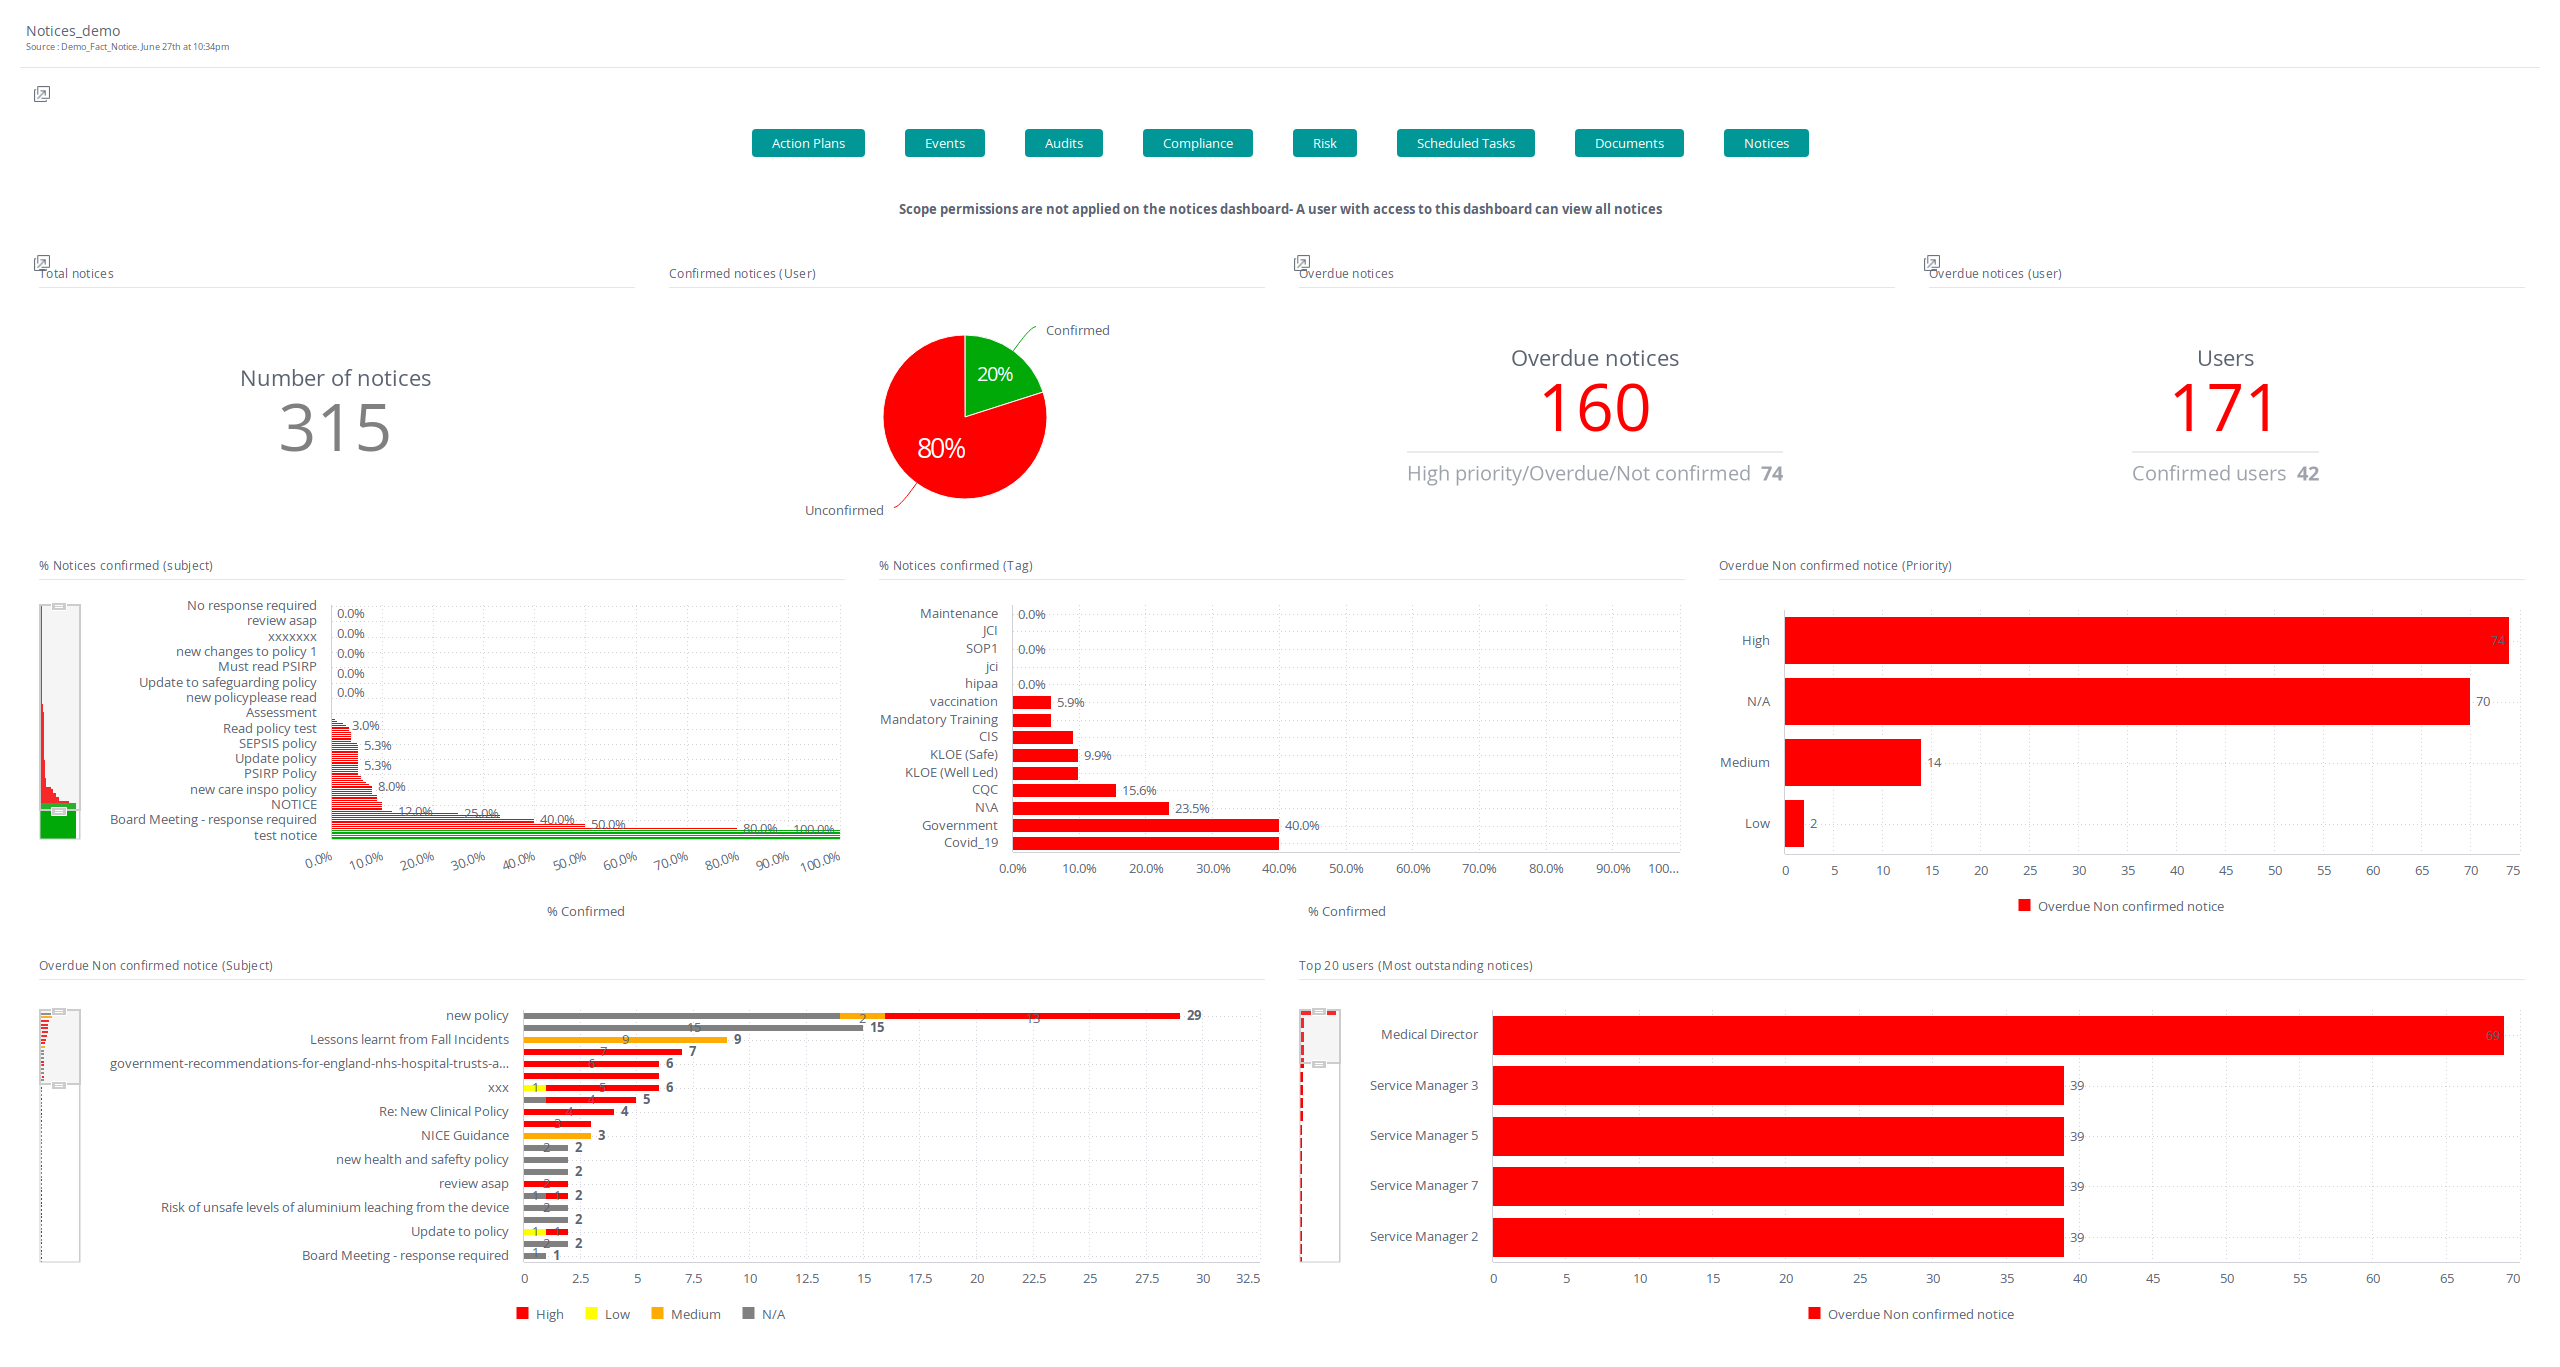
| Notices | This is your core overview of notices. Track key metrics including; the number of notices created and sent, % of notices confirmed, the number of notices overdue, and more. Org, Region and Location scope permissions are not applied on the notices dashboard. A user with access to this dashboard can view all notices. Use this dashboard to keep on top of overdue notices and track your teams’ engagement with notices. |
Risk Register Dashboards
| Dashboard Names | Description |
|---|---|
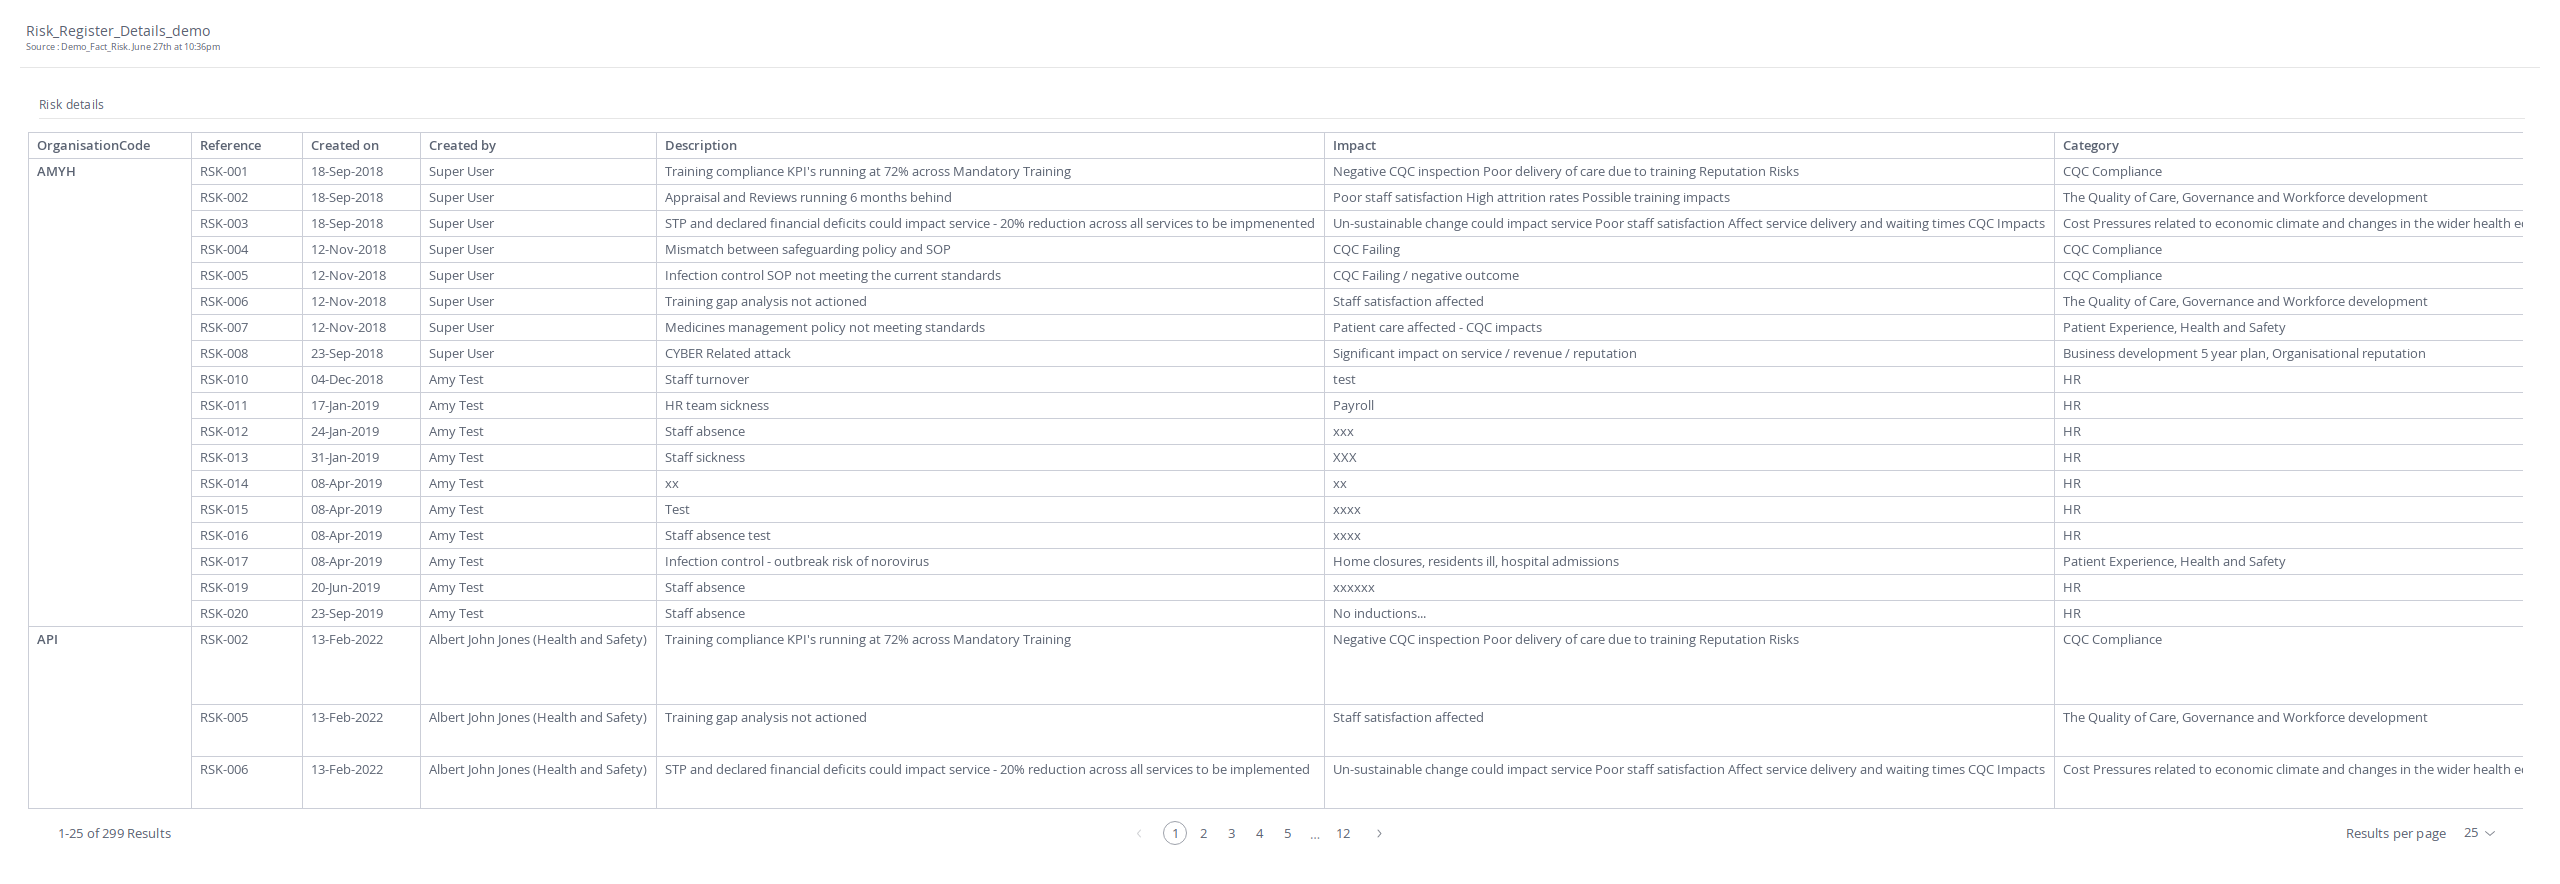
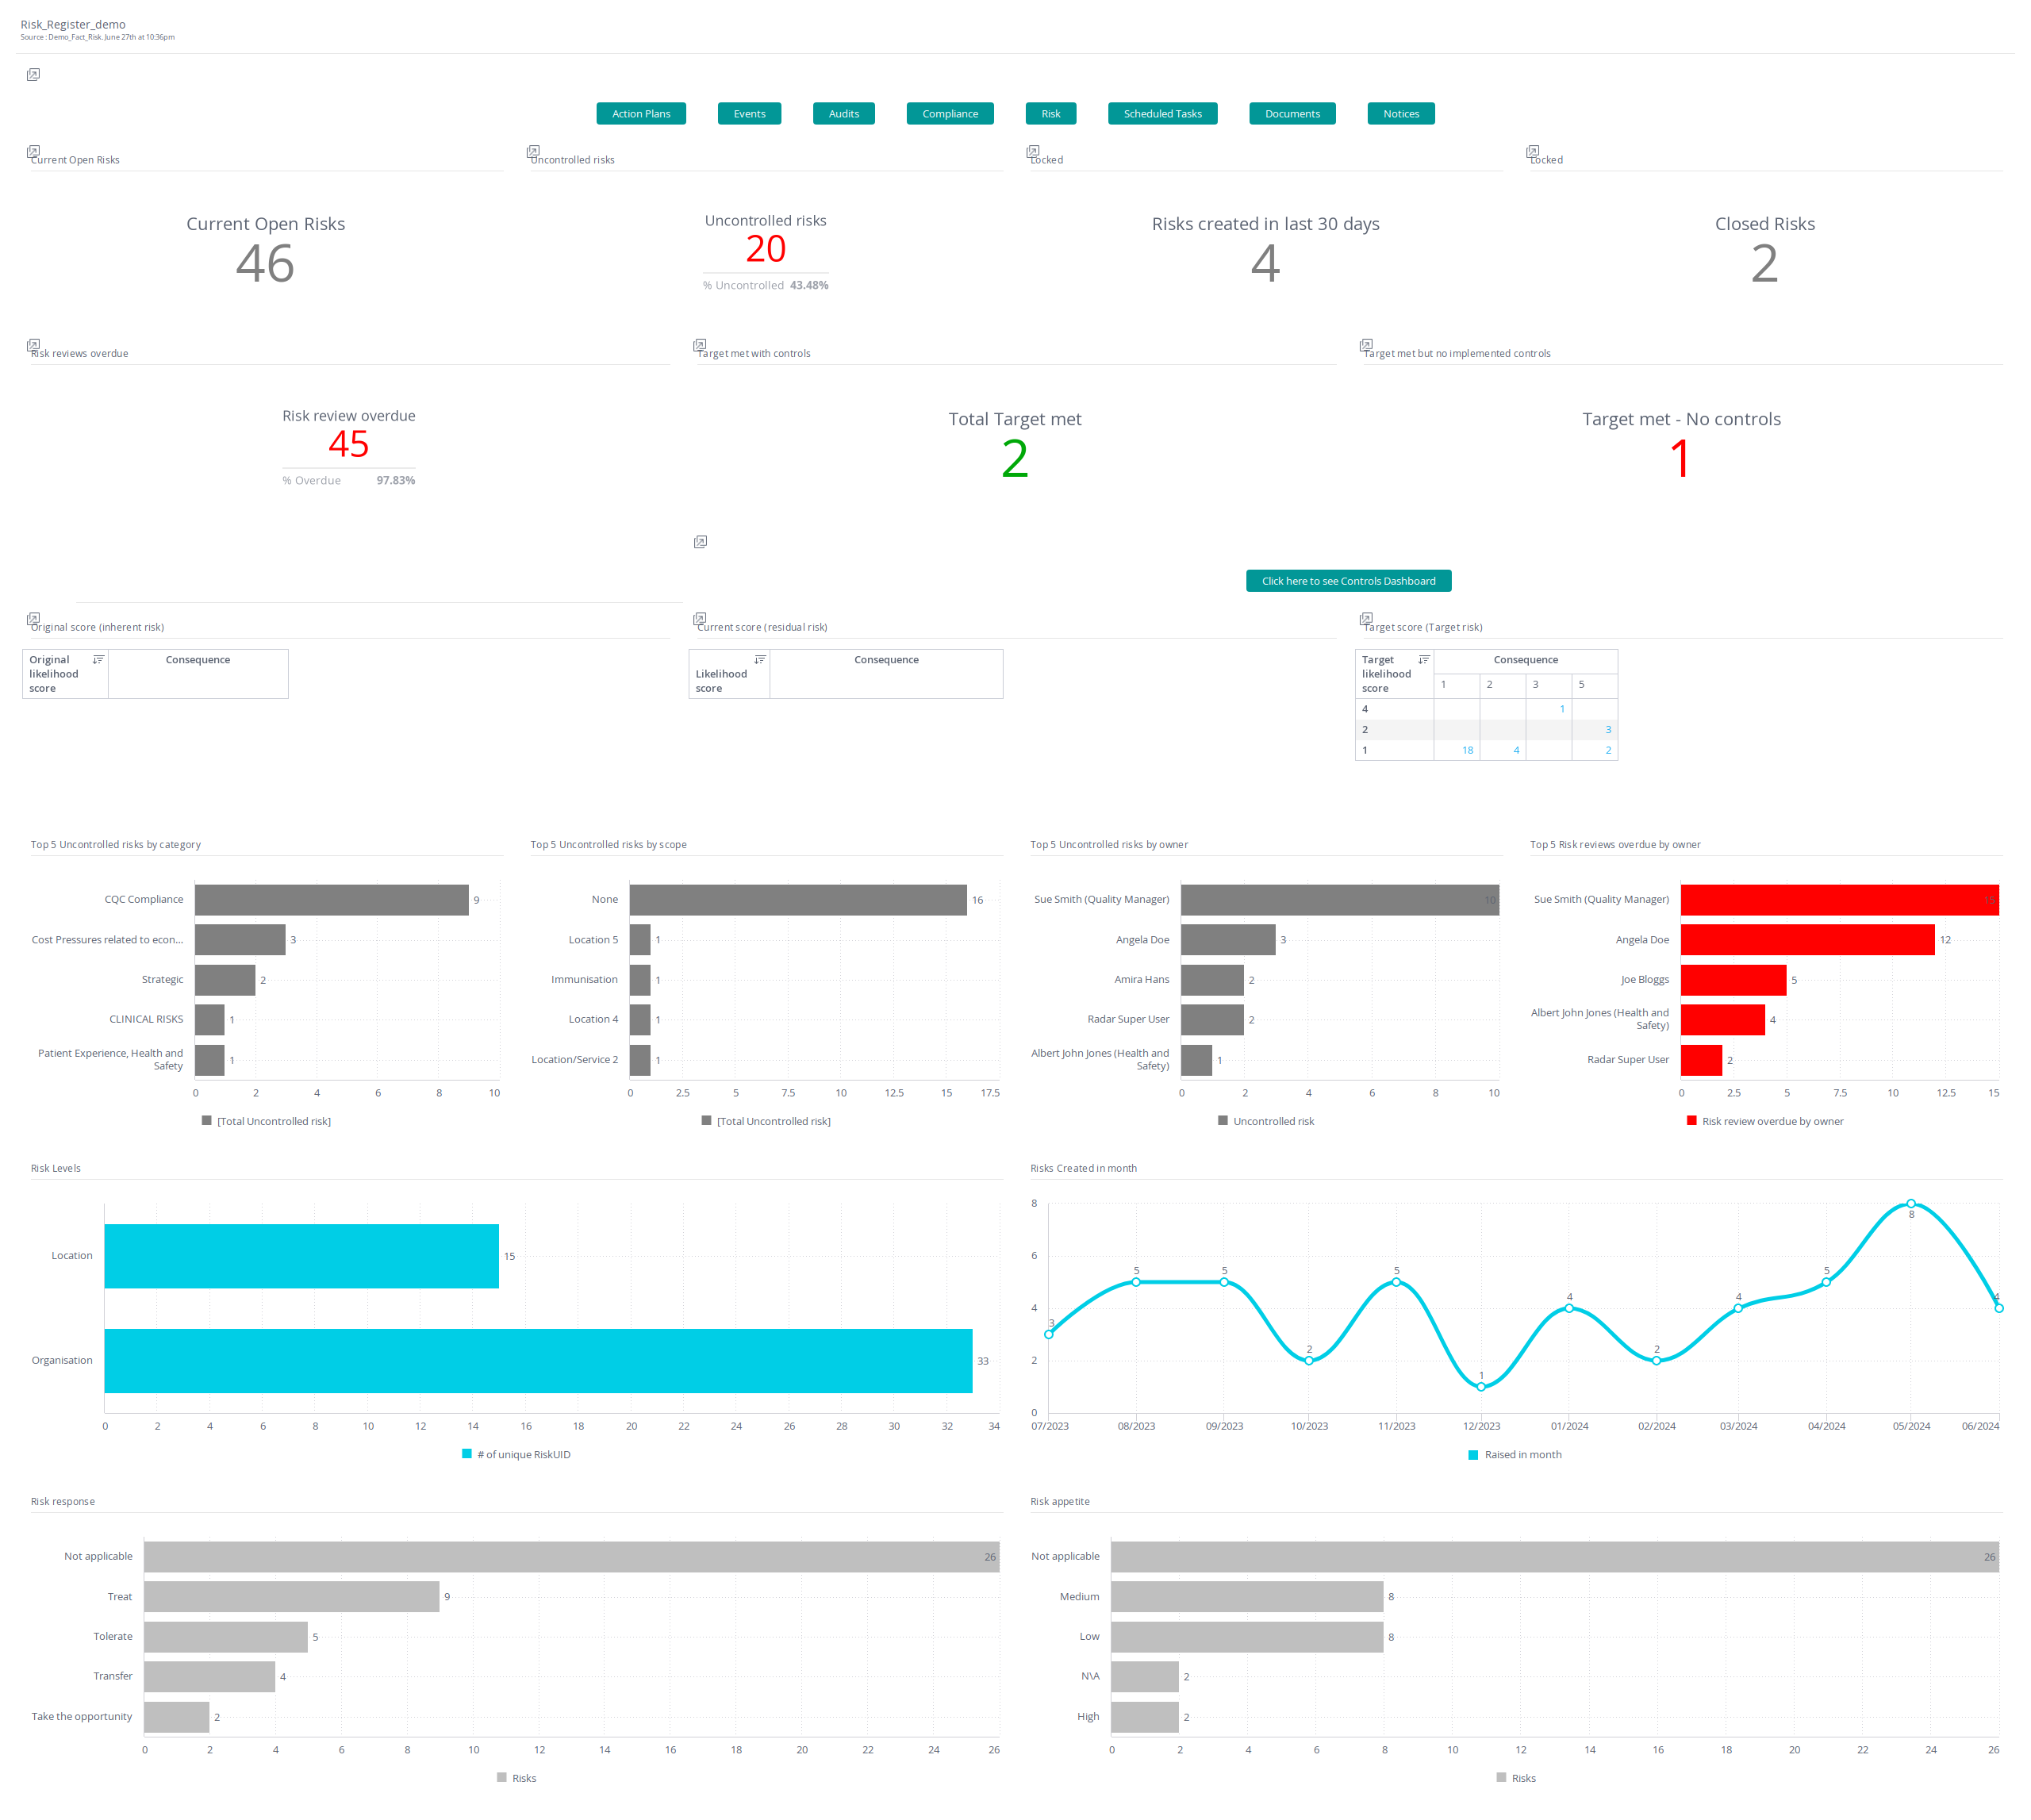
| Risk_Register_Details | This is your core overview of risks. Track key metrics including number and status of open risks, number of risks by score, number of uncontrolled risks, the number of risks, overdue controls and risk reviews within a given time period Org, Region and Location scope permissions are not applied on the notices dashboard - A user with access to this dashboard can view all risks. |
| Risk_Register | This dashboard shows all risks along with key details, such as scope, owner, review date, last comment, score, number of controls in place etc. This table overview of risk register details that can be downloaded in a CSV. |
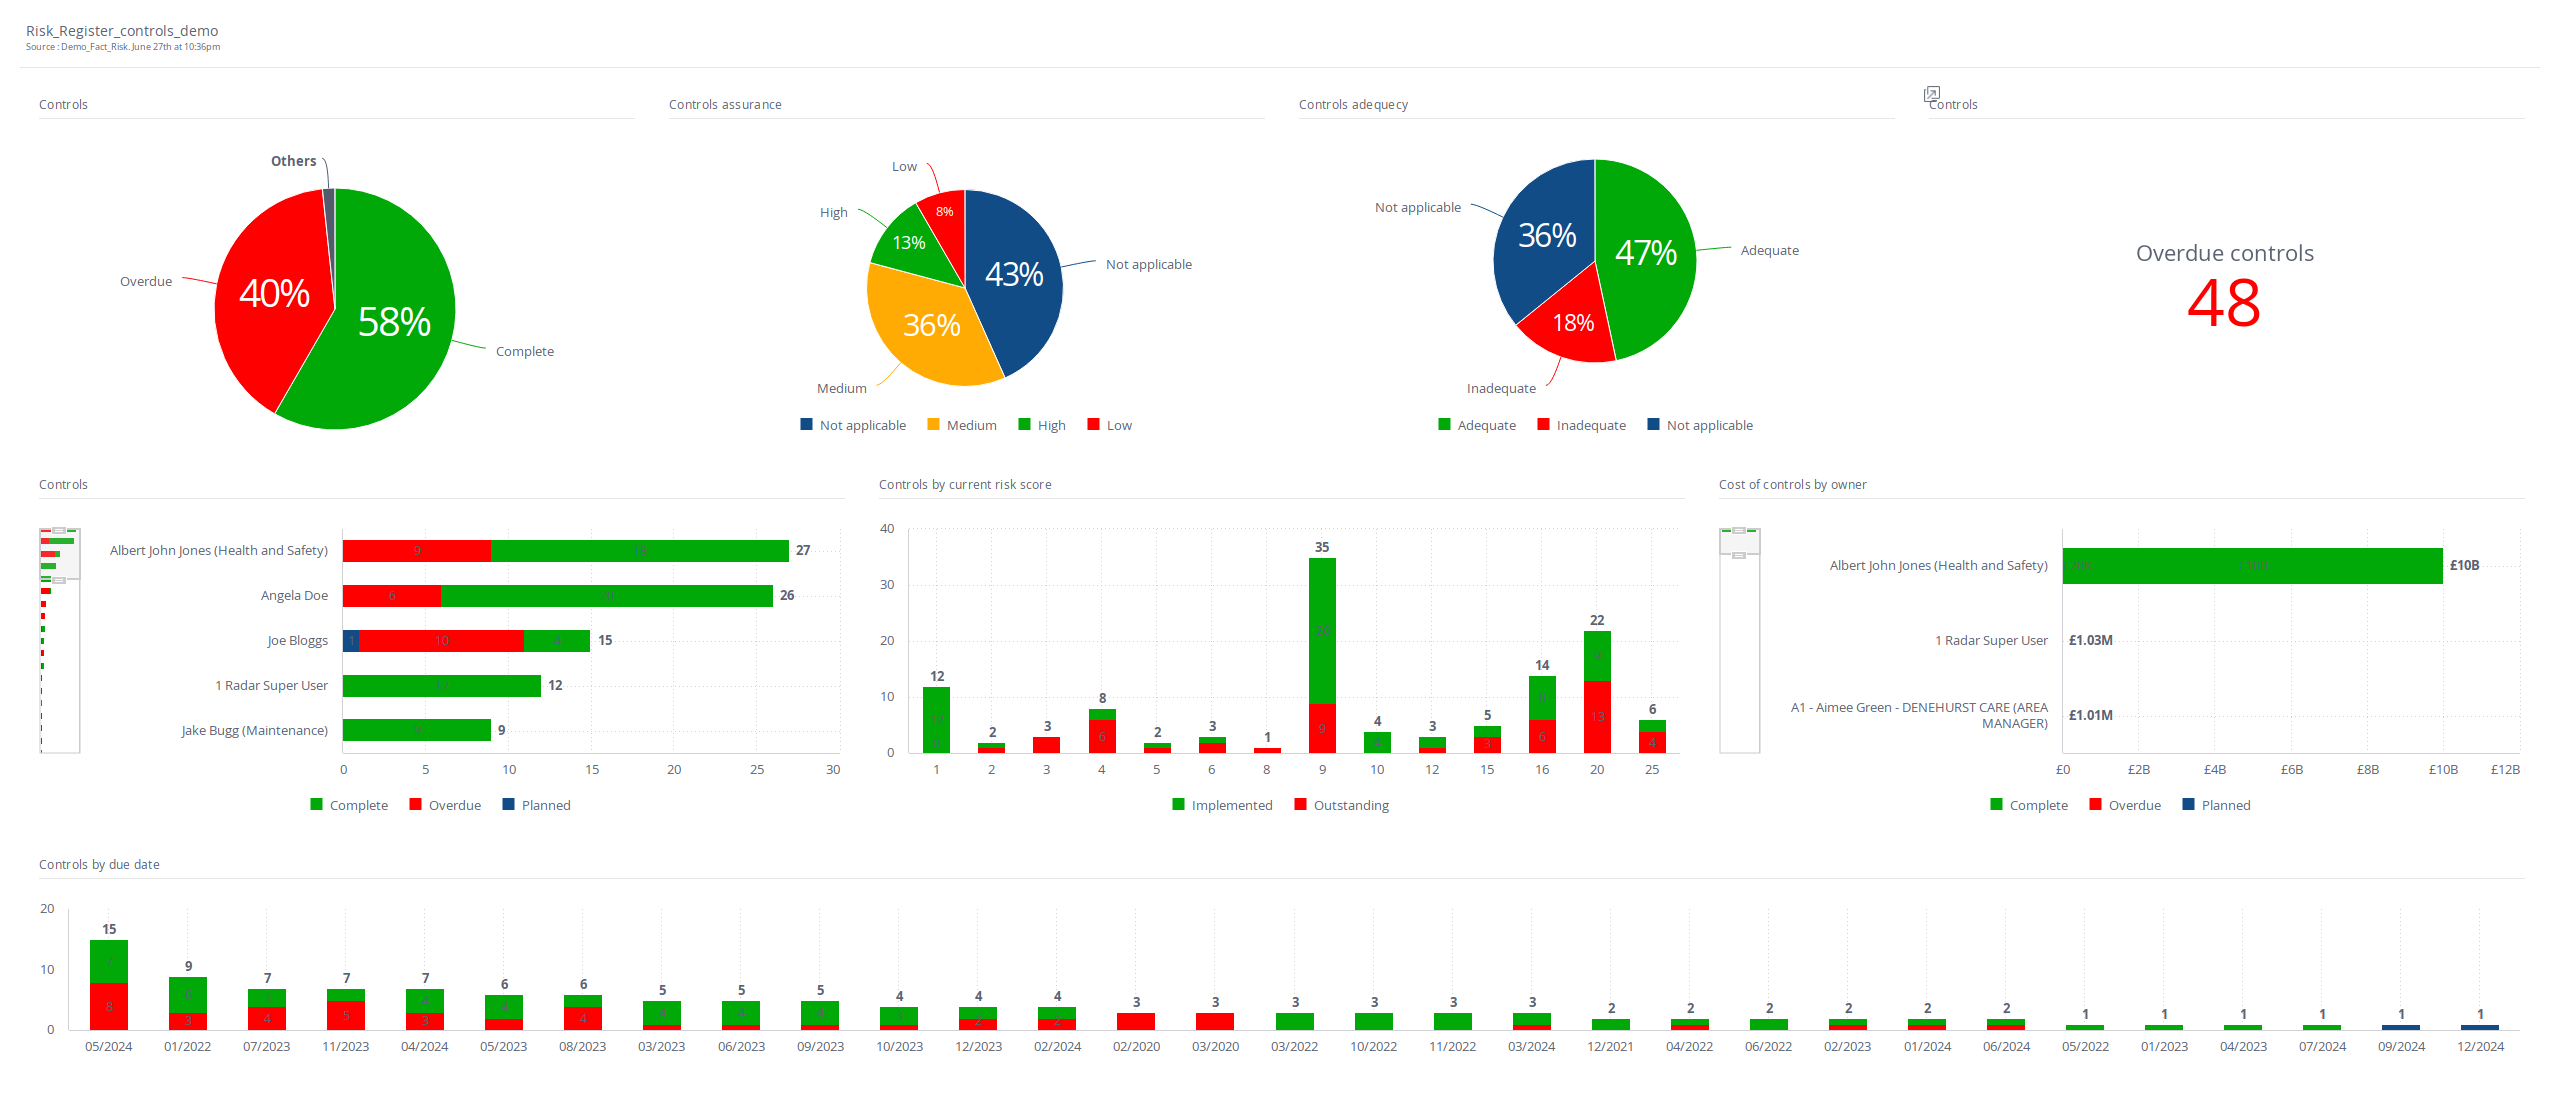
| Risk_Register_controls | This dashboard is an overview of risk controls in your system. Examples of data include number and status of controls, % by adequacy and assurance, number of overdue controls, controls filterable by owner, risk score and cost of control. Use this dashboard to keep on top of overdue risk controls and monitor adequacy and staff workloads. |
Scheduled Tasks Dashboard
| Dashboard Names | Description |
|---|---|
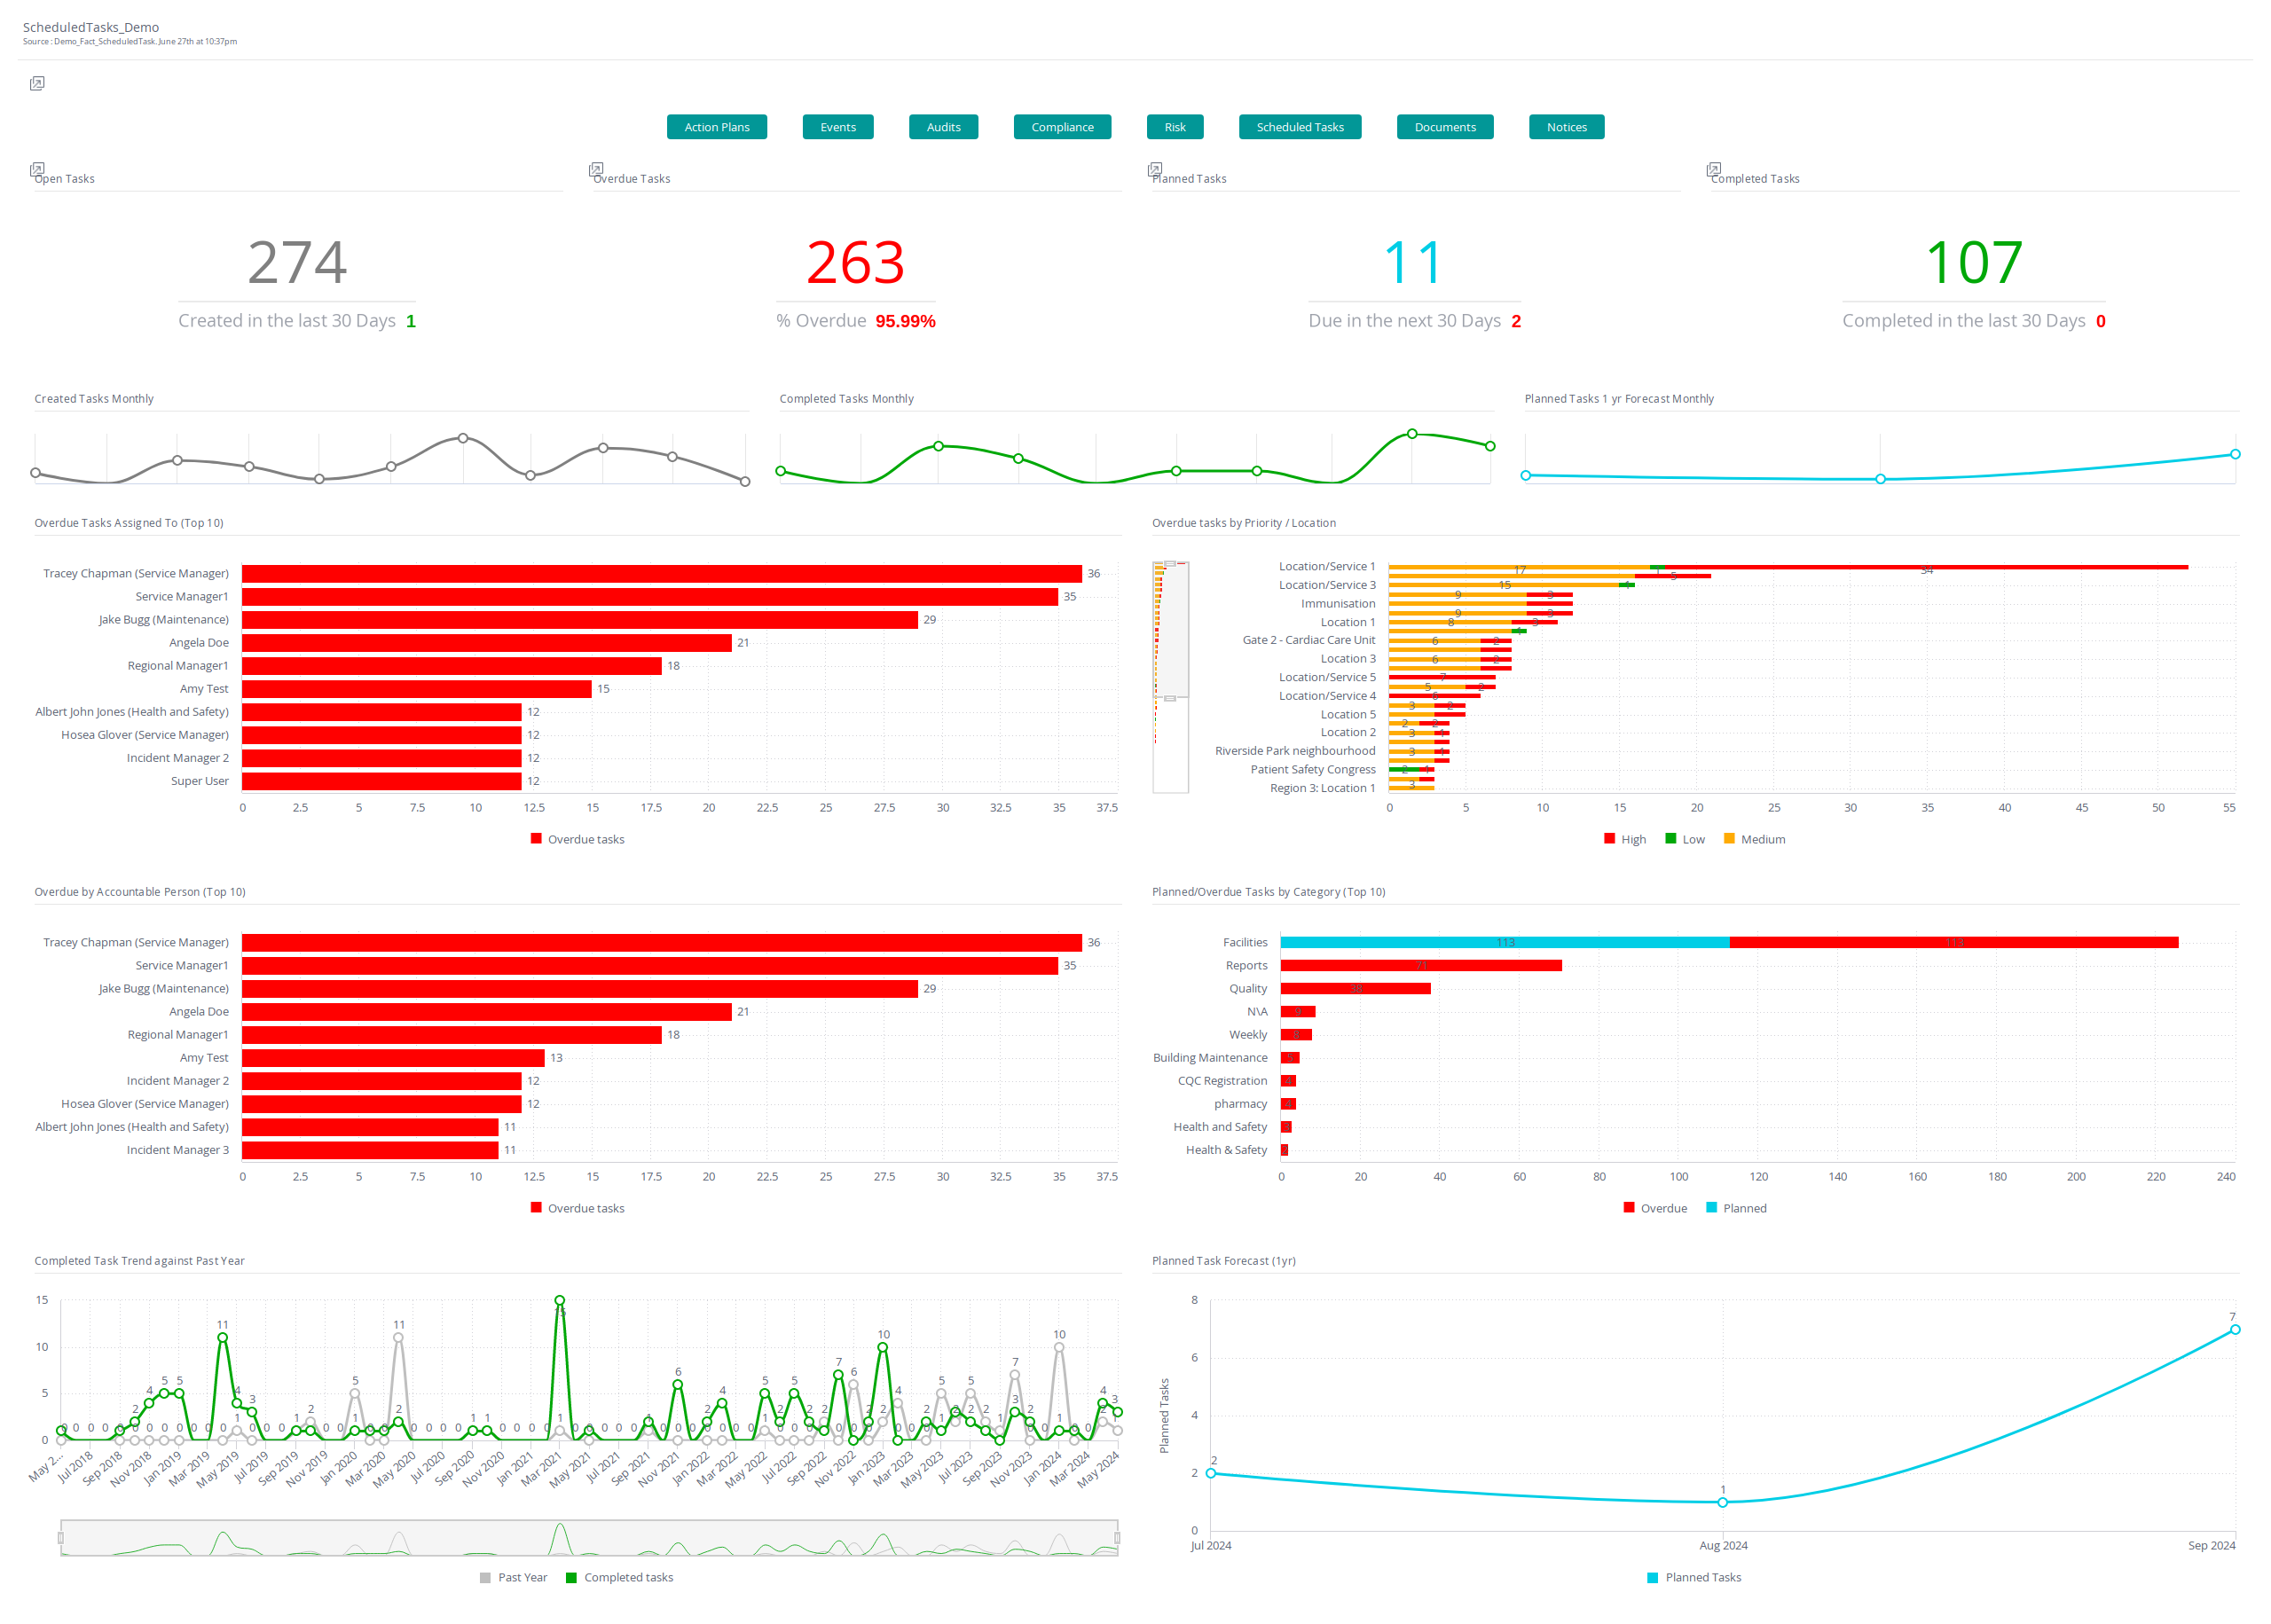
| ScheduledTasks | This is your core overview of Scheduled Tasks. This dashboard allows you to track the number of tasks by status, trends of tasks, tasks by assignee and location, year on year trends and forecasts of tasks for the next 12 months. Use this dashboard to keep on top of overdue scheduled tasks and track your teams’ workloads. |
Workforce Compliance Dashboards
| Dashboard Names | Description |
|---|---|
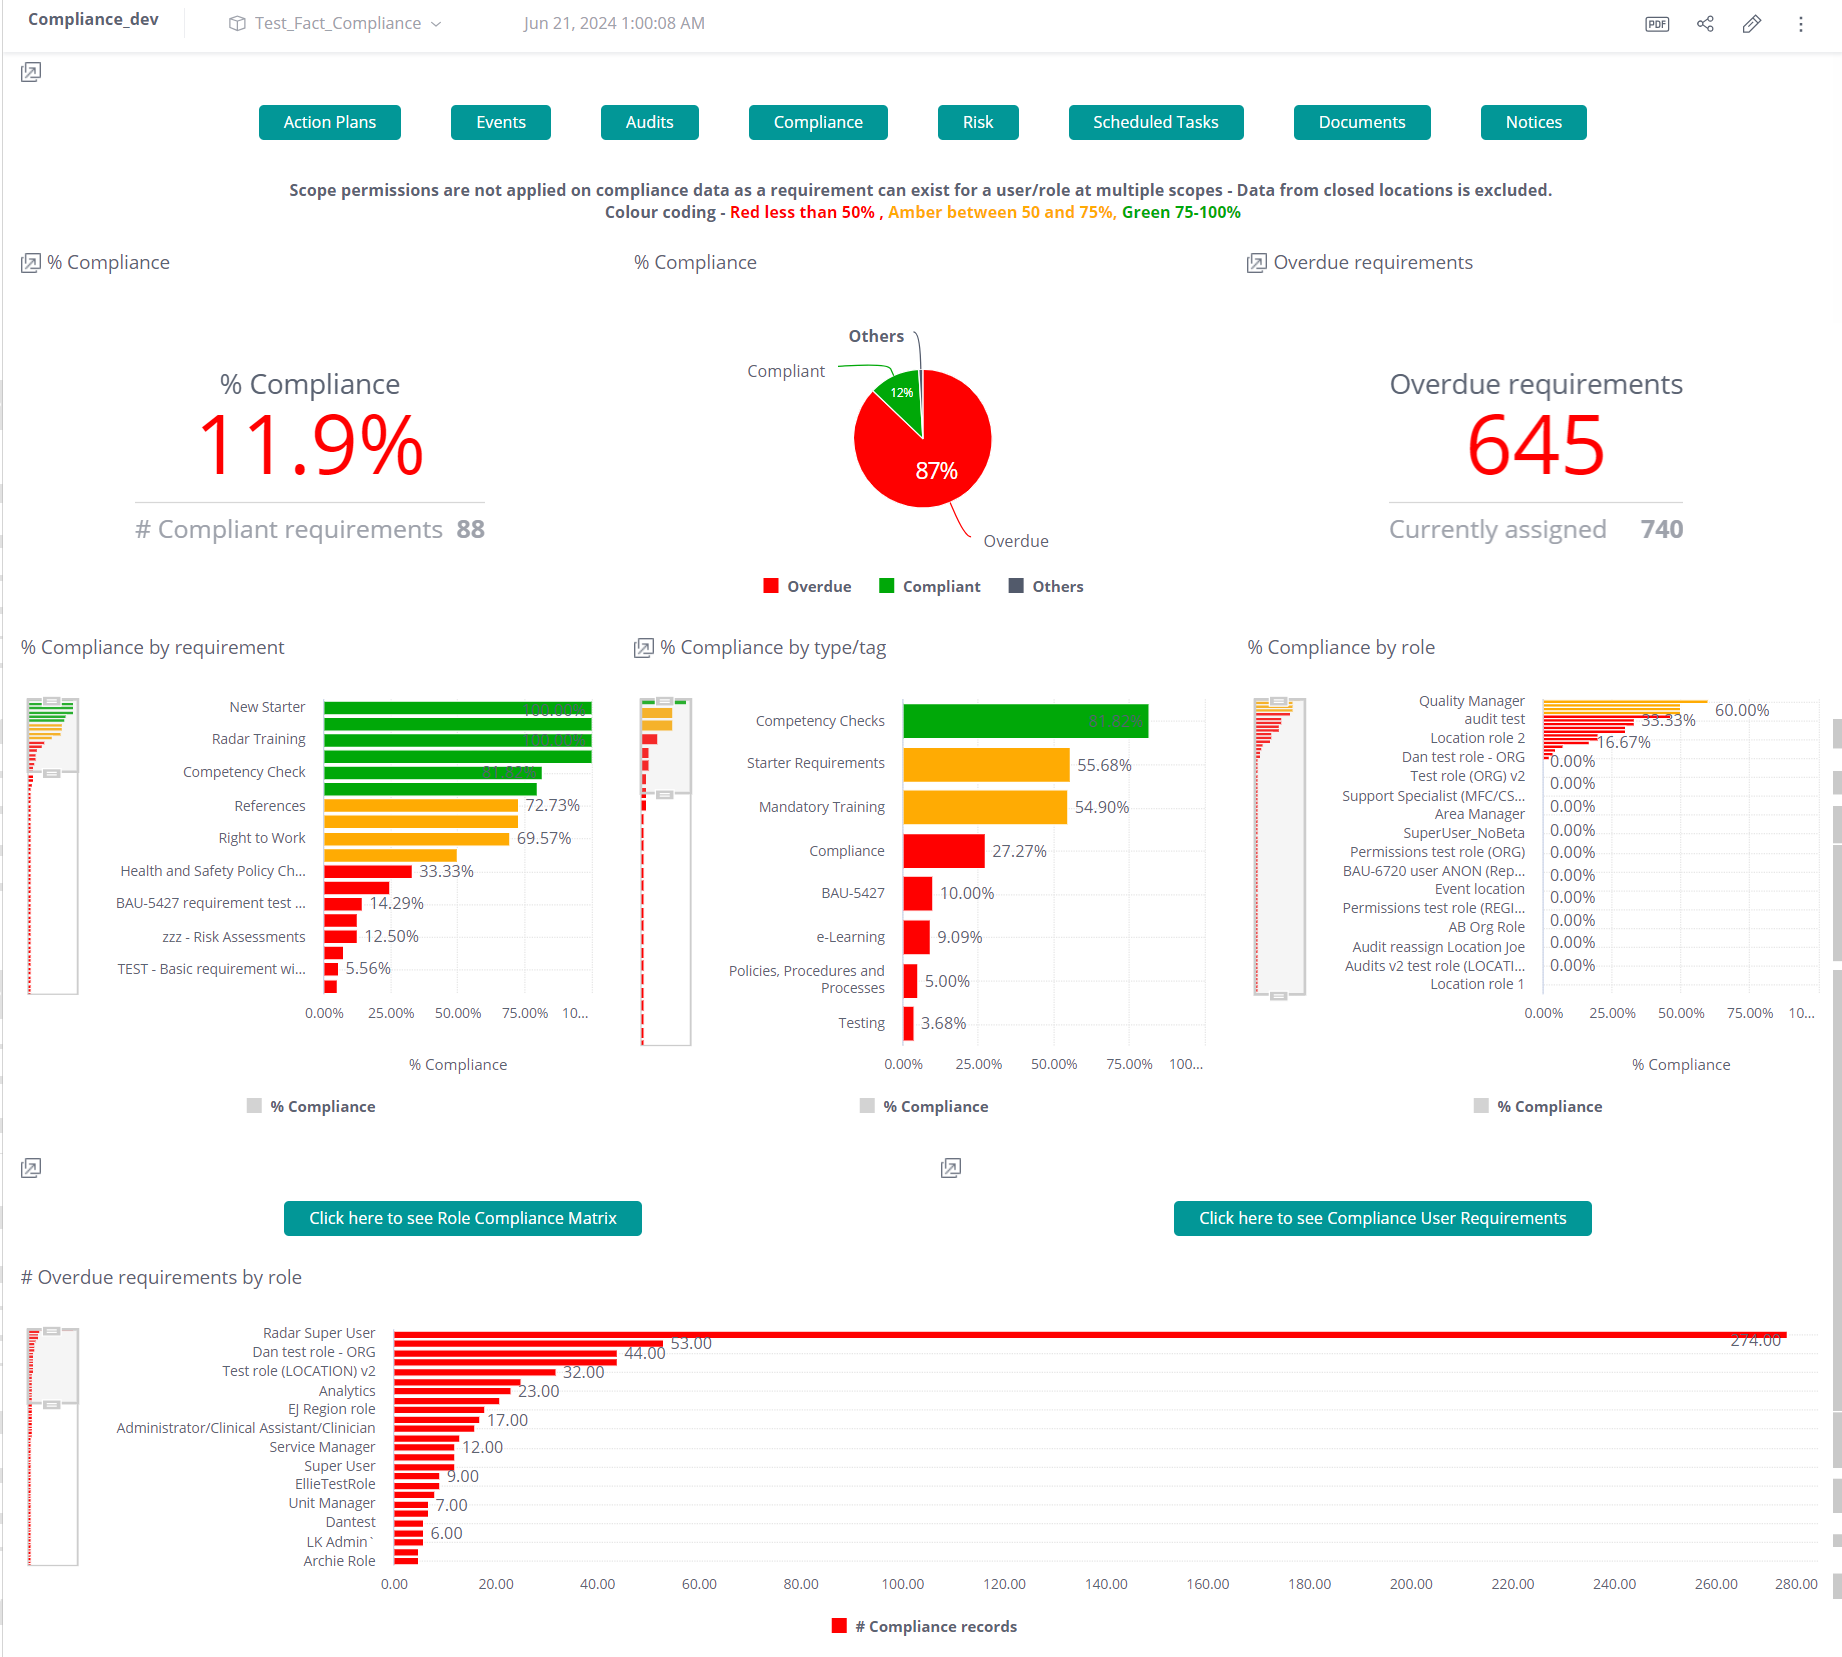
| Compliance | This is your core overview of staff compliance. Track key metrics including; compliance percentage by type/role/tag, overdue requirements, role matrix, due dates, and view the compliance matrix table. Org, Region and Location scope are not applied to compliance data, a requirement can exist for a user/role at multiple scopes. Data from closed locations are not included. Use this dashboard to keep on top of overdue compliance and track your teams’ engagement with their compliance tasks. |
| Compliance_Location | See and overview of staff compliance by Locations in your system. Data includes compliance by location/tag/role, location compliance matrix (and more). Org, Region and Location scope are not applied to compliance data, a requirement can exist for a user/role at multiple scopes. Data from closed locations are not included. |
