
Reading time 1 min
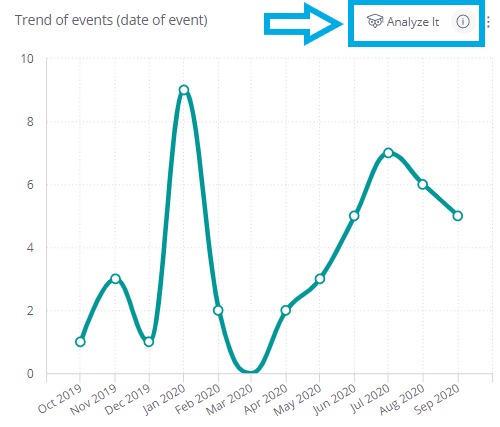
- You can add trend lines to any of the chart widgets on your analytics dashboard using the Analyse it tool.
- To do this, simply hover over the chart widget on your Analytics dashboard to reveal the Analyse it option.
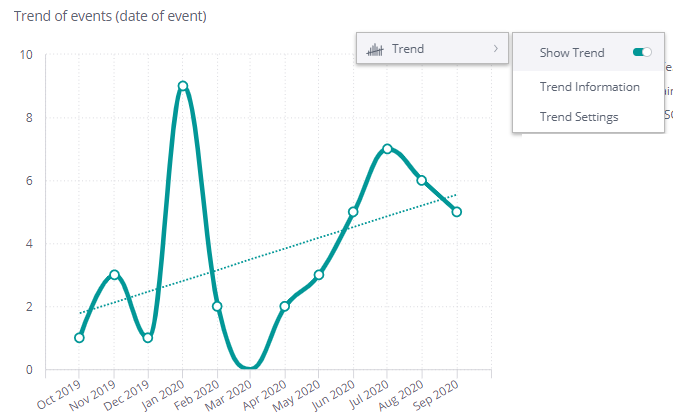
- To switch the Trend line on, simply click on the toggle to activate.
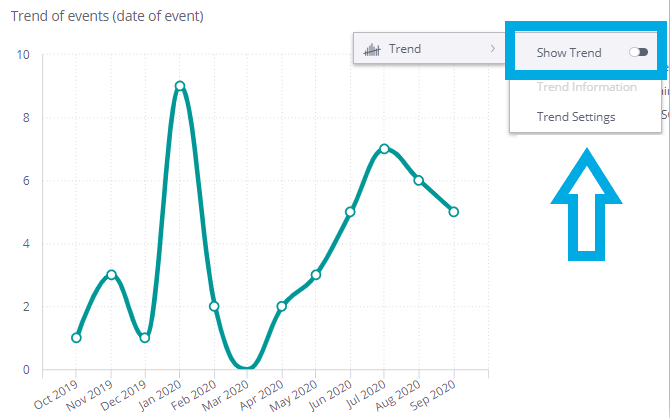
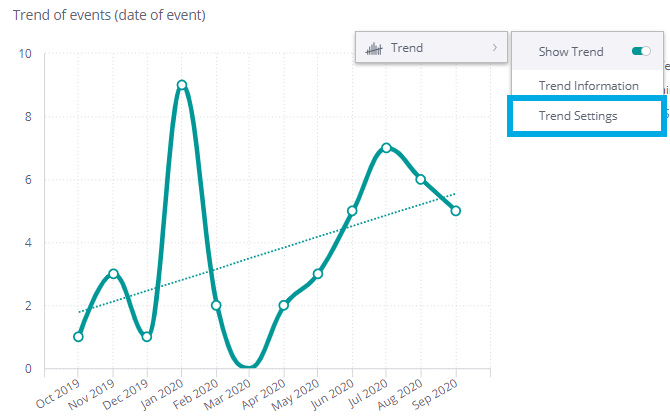
- You will now see a trend line on your chart:
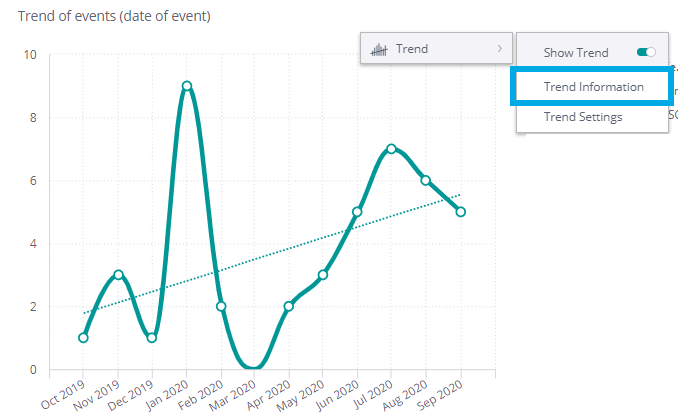
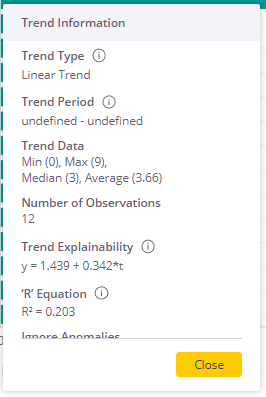
Trend Information
- The Trend Information option will show you details about the trend of your chart, including the type of Trend line being used, trend averages, etc.
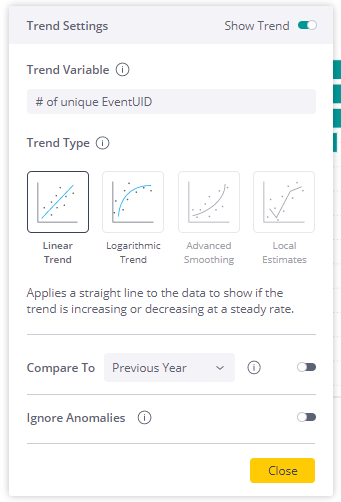
Trend Settings
- You can specify the type of Trend line you wish to use, along with other options using Trend Settings.