Reading time 3 mins
Introduction
- You can interact set filters on the Analytics Dashboard either through the Filters pane or by simply selecting values on the widgets themselves.
- Each time you interact with a filter, for example by selecting or entering a value, the filter is immediately applied to your dashboard. You will not affect anyone else by changing the filters.
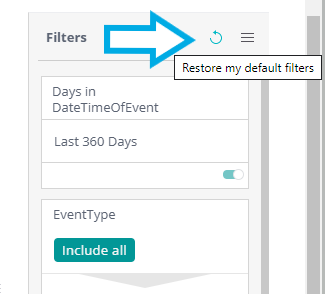
- In addition, you can restore the original state of the dashboard at any given point by selecting the Restore default filters icon from the top of the filter pane.
- Note - Radar Healthcare Analytics updates overnight and so will not show any data from the same day
Setting filters using the widgets
- To set a filter using the dashboard widgets, simply click on the widget in question, e.g., to view items by location, simply select the relevant location from the location bar chart on your dashboard:
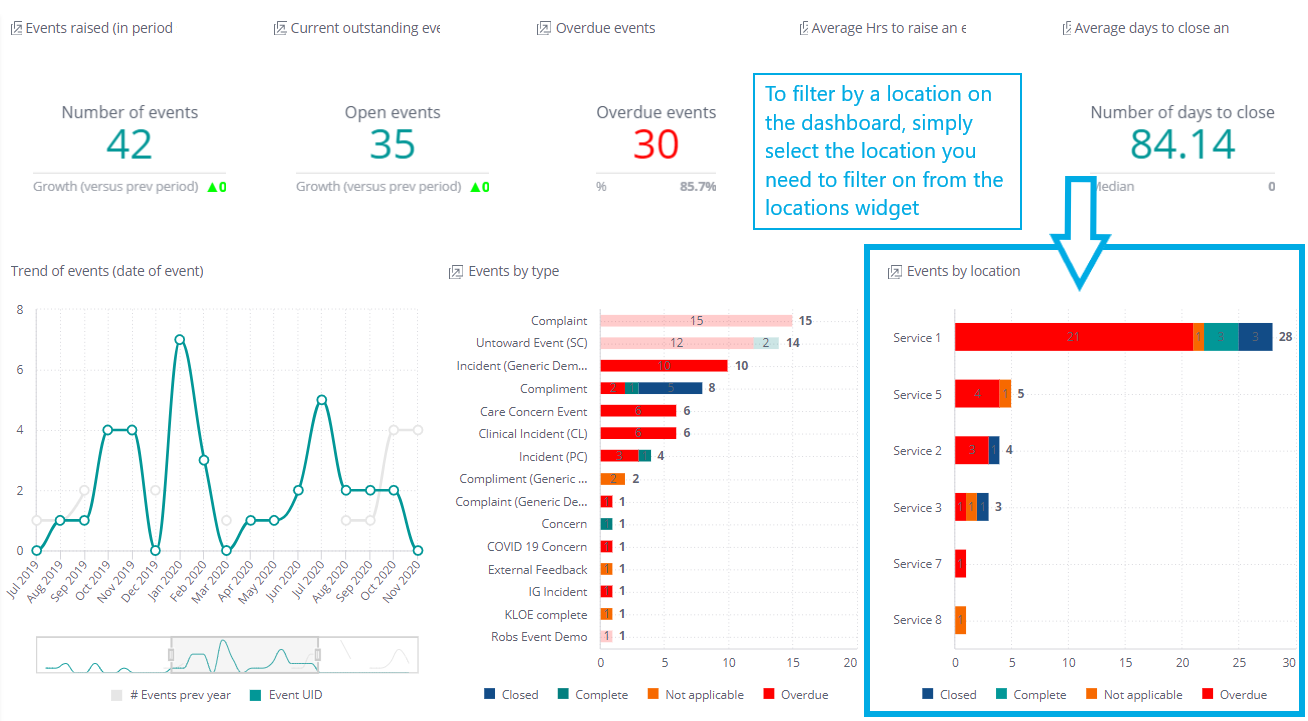
- The full dashboard will then update automatically.
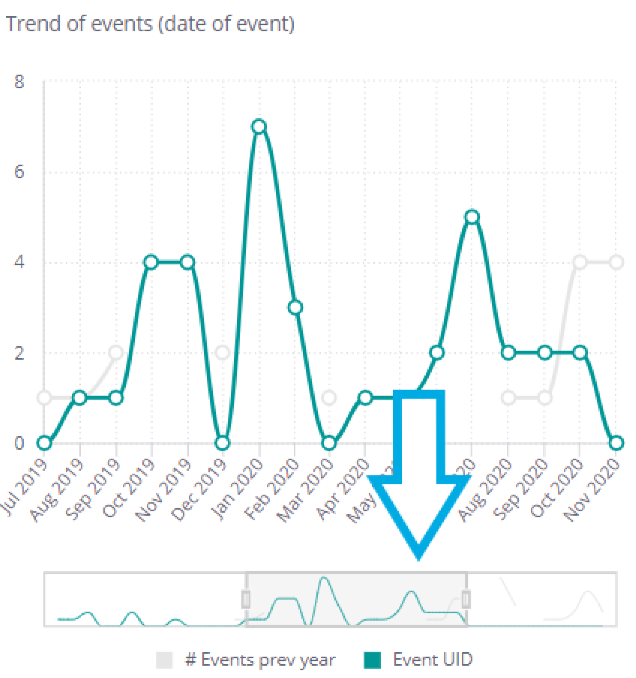
- For the chart widgets, if you have too much information to easily fit on the page, you can use the selector below or to the left of the widget to choose how much information is displayed on screen.
- Simply slide the selector to show the selection you wish to include, and the graph will update accordingly to only show those included in the slider:
Setting filters using the Filters side panel
- To reveal or hide the filter panel, click on the right-hand menu arrow.
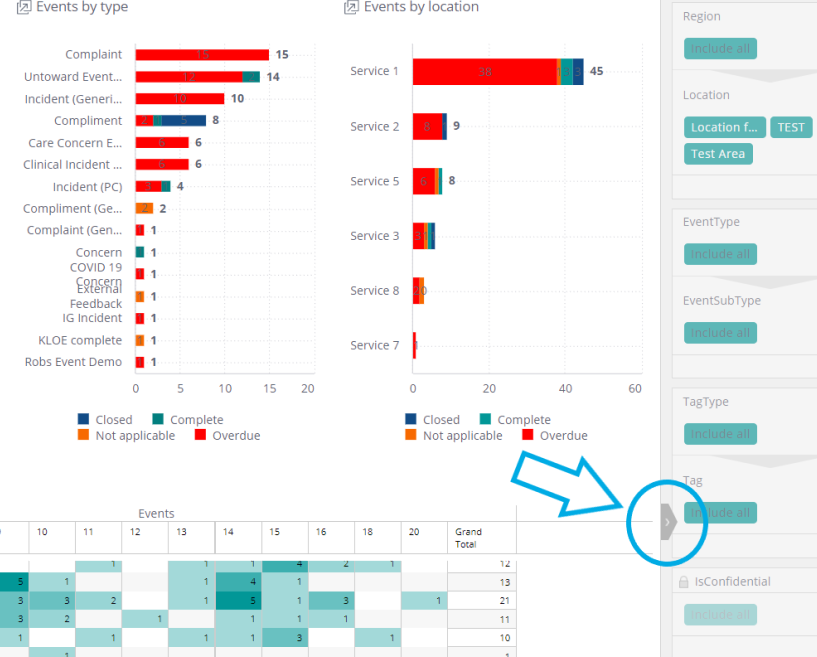
- The filter panel will now display on the right hand of the screen.
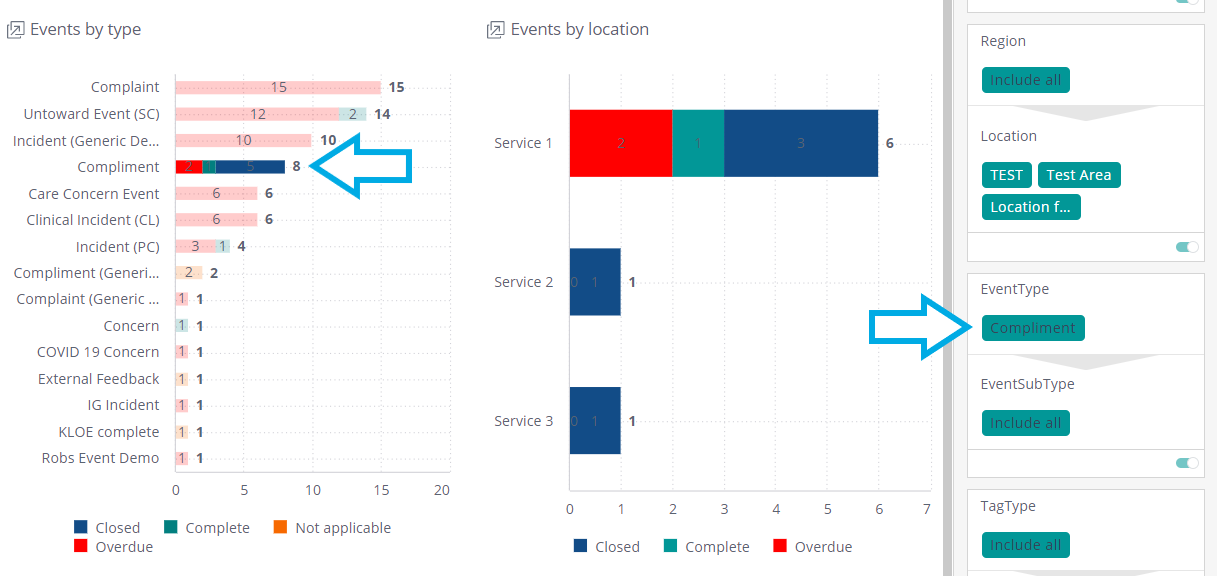
- Any filters that were applied using the widgets on the dashboard (as described above) will be showing on this filter panel. For example, in the screen shot below, a filter was added to the "Events by type" widget to only show Compliments by clicking on the Compliments bar on the widget itself. This filter can also be seen on the right-hand filter panel.
- Filters can also be set on this right-hand filter panel.
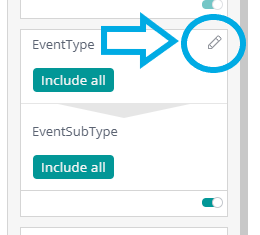
- To set a filter, click on the pencil icon on the right-hand corner of the relevant filter option (you may need to hover over the right-hand corner to reveal the pencil.
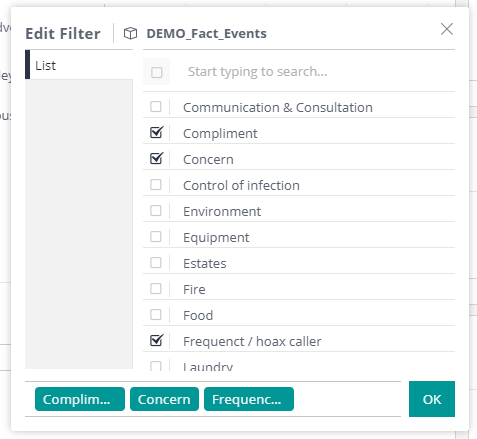
- You can now select/deselect the options you want to show on your report - click OK to apply the filters.
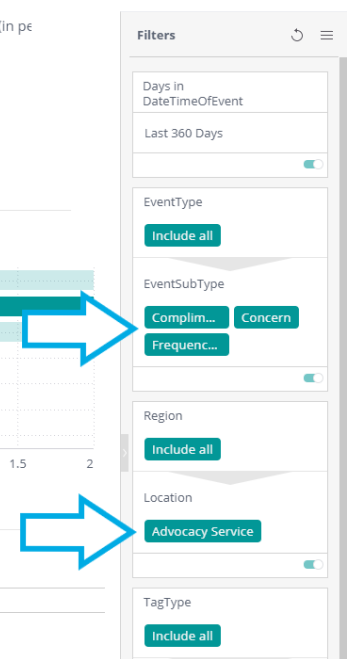
- The dashboard will now update according to the filters set and the filters will be shown on the filter panel.
Clearing filters
- Filters can be cleared in a few different ways.
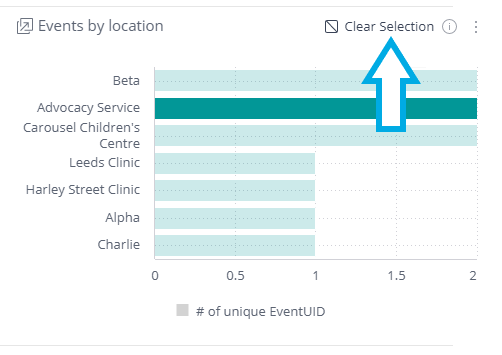
- From the dashboard widget with a filter applied, select Clear Selection.
- From the right-hand filter panel, click the circular arrow to restore all filters back to your default setting.
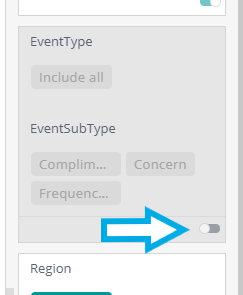
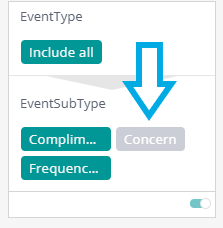
- Alternatively, you can temporarily disable filters using the right-hand filter panel by either clicking on the filter test or using the sliding toggle on the relevant filter section.
- In the below image the Concern filter has been temporarily disabled by simply clicking the filter here.
- In the below image all Event Sub-Type filters have been temporarily disabled using the sliding toggle.
