

Reading Time 5 mins
Introduction
- Explanations are a means of discovering the root causes of trends within your data, for example, if you saw a sudden spike or decrease in a particular dataset.
- They can also help you to discover data insights and trends which may not be immediately obvious upon first looking at the data. It highlights the insights/trends that appear within your data and the fields behind that insight/trend, possibly surfacing a data point you may wish to focus on.
Enabling Explanations
- Explanations are enabled by default. Should you wish to toggle the feature on/off you can do so at cube level by navigating to the Admin tab, searching for Feature Management under App Configuration. Then, in the AI section you can switch the feature on or off.
Using Explanations
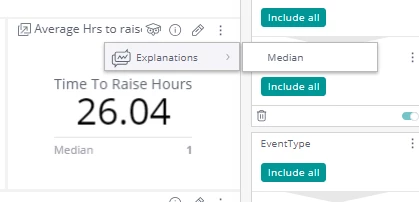
- To access the feature from a widget, click ‘Analyse it’ and then ‘Explanations’. You will then be able to choose which data point you wish to explore.
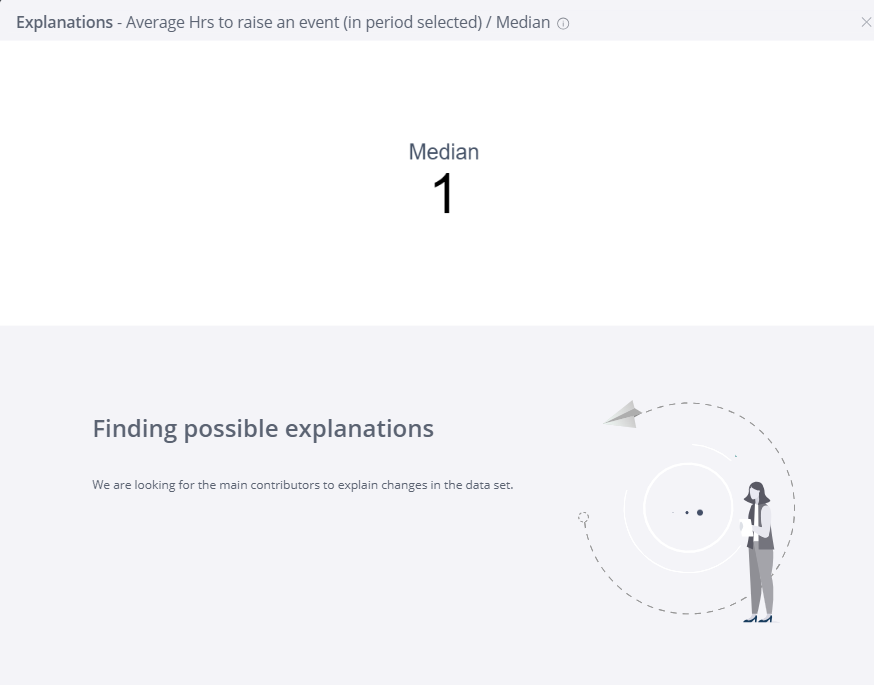
- By selecting the data point, you will be presented with a visulation on the data that has been logged so far.
- By clicking on the visulisation, the system will suggest probable fields driving the data point/trend.
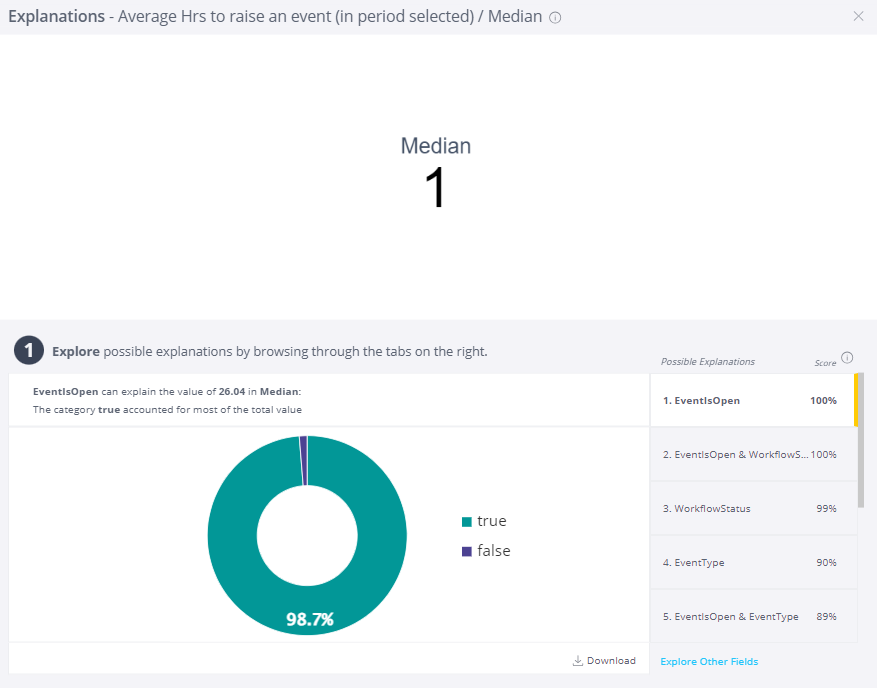
- The system presents the top ten fields that contributed most significantly to the change between the selected data point and a previous point.
- Each suggestion field will be accompanied by percentage score as to how accurate the system believes the explanation to be - a calculation of how much the field contributed to the trend.
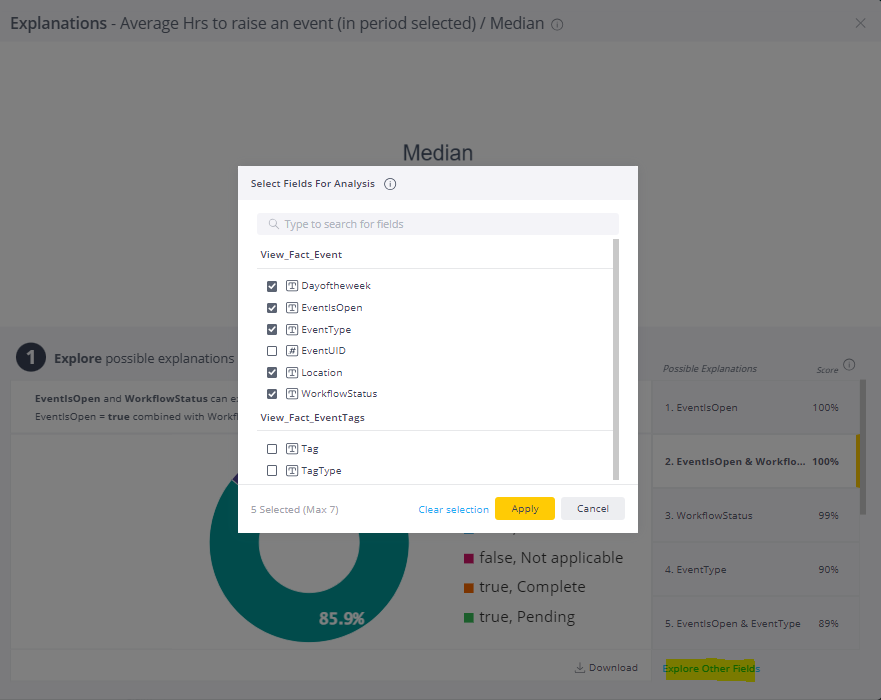
- If you select Explore Other Fields you can bring in further fields which may not have initially appeared to see what bearing they have on the data.
- Explanations uses a Knowledge Graph to identify relevant fields and pull them into the analysis, even if they aren’t included in the dashboard. This ensures those using the feature have all the possible explaining factors available to them and avoids having to add unnecessary information/data to your dashboards.
Changing the fields included
- Dashboard Designers can decide which fields are included in Explanations results. By default, the features includes any fields across all dashboards, though this can be changed to include only fields that appear in the specific dashboard.
- To do this, from your dashboard click Dashboard Settings, and in the Explanations section, select the required option from the drop-down menu. Then click Apply.
- Please note that in all settings, Viewers will only see Explanations that are based on fields that they are authorised to see.
Downloading Explanations
- Explanations can be downloaded from the dashboard. In the Observed Explanation section, click Download Image. This downloads the an image of the Explanations screen as a PNG file.