

Reading Time 5 mins
Introduction
- Simply Ask is our natural language querier. It enables you to ask questions of your analytics dashboards in every day language and the system will present the results to you. It is a means of accessing the data a user needs in a simple and easy way.
Activation
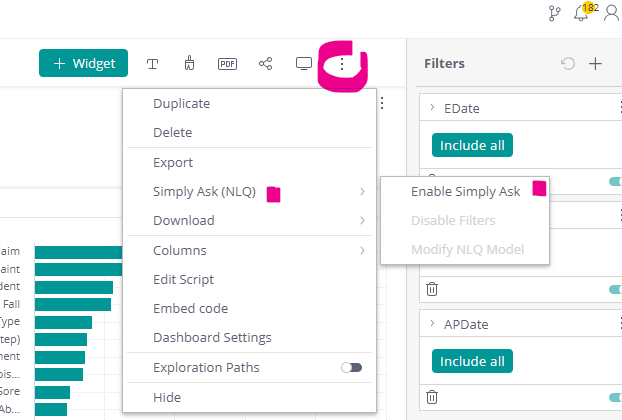
- To add the feature onto a dashboard, open the dashboard menu and select Simply Ask (NQL) > Enable Simply ask.
- This enables the feature for the Dashboard Designer. When the Designer republishes the dashboard and shares it with Viewers, those Viewers will also see the Simply Ask button.
Using Simply Ask
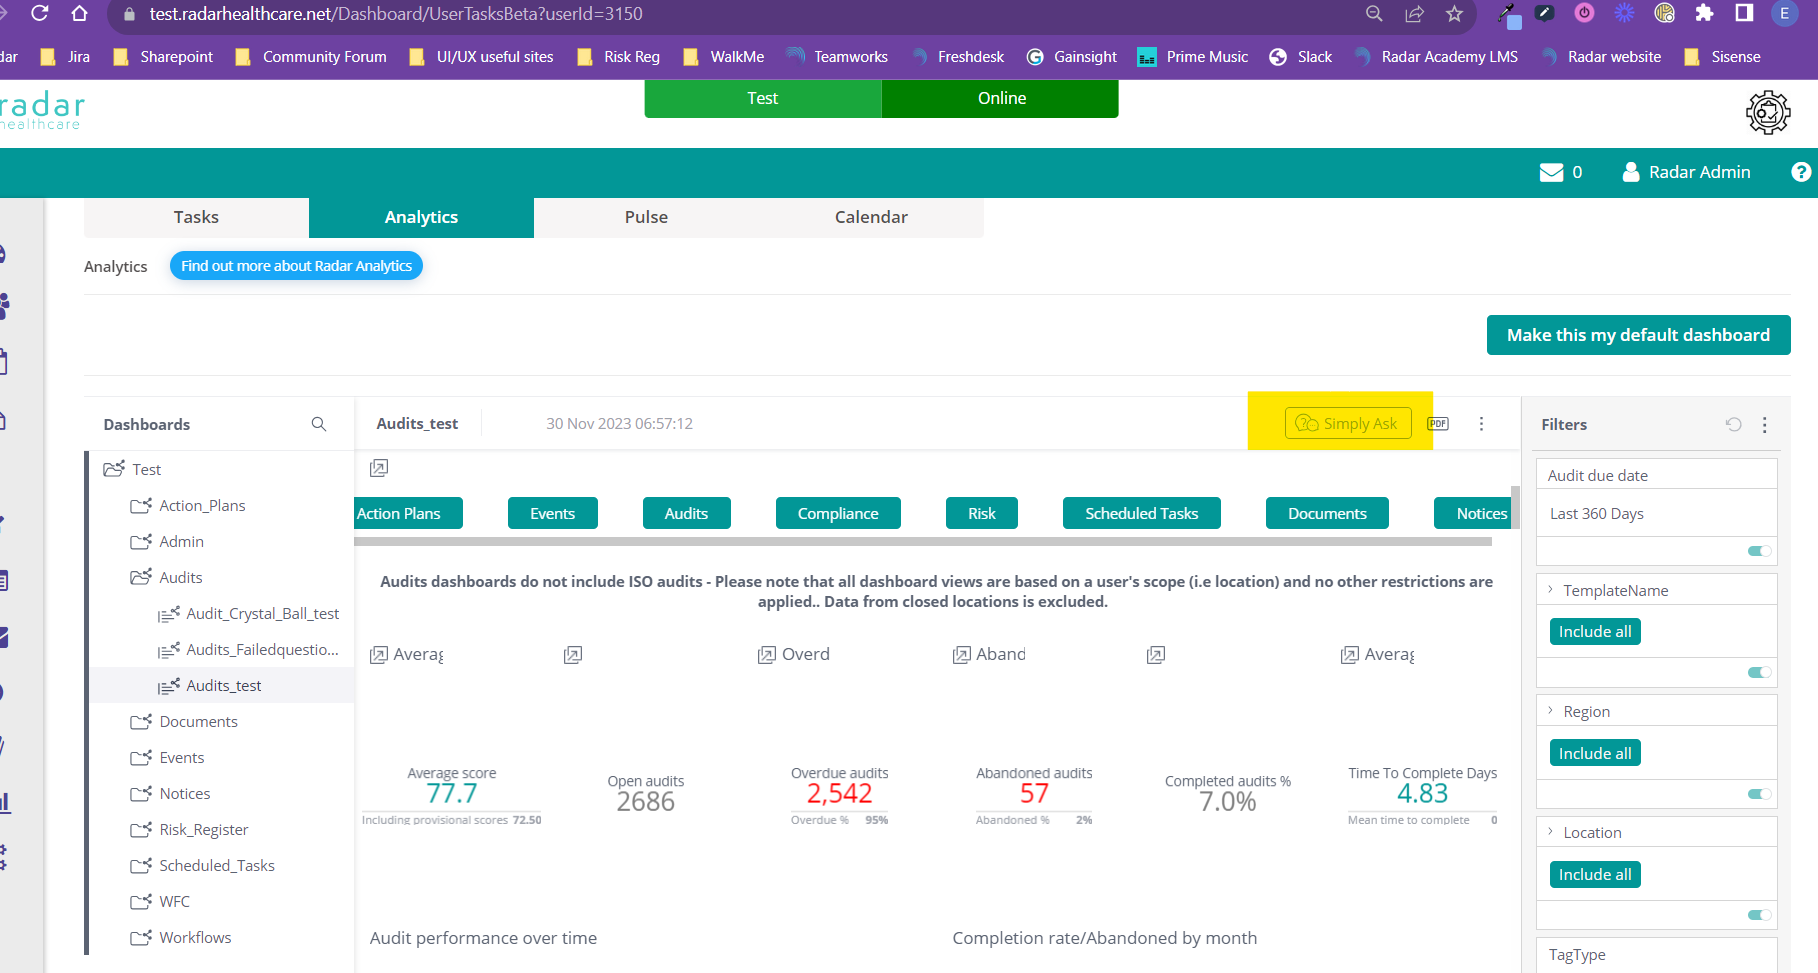
- To ask a question of Simply Ask, first click the option, this presents you with the Simply Ask interface.
- Type your question into the ‘Ask a question about your data’ field.
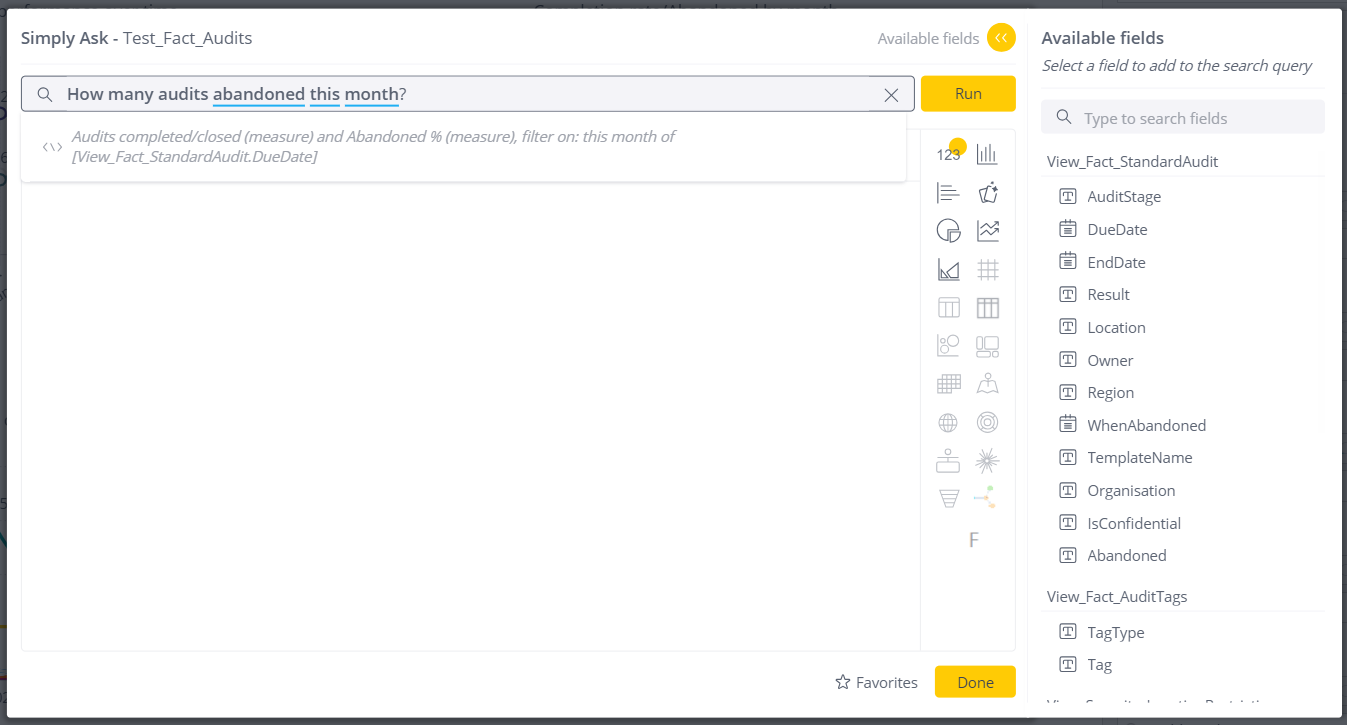
- As you do so, you will receive suggestions for information you may be looking for. This is the system attempting to understand what you are asking using the Knowledge Graph, which looks at the data fields available and the different ways you may group those fields (for example, by location or event type).
- Simply Ask will automatically detect synonyms for words used, for example if you ask for data by a region, it will associated region with location.
- Simply Ask will offer a number of different type of suggestions as you type your query such as:
- Automatic suggestion for the next word
- Spellcheck
- Ambiguity resolution (if a word entered can be associated with more than one column)
- Word auto-complete
- Synonym translation (if a word entered if not part of your data)
- Once your question has been entered, click Run to produce a visualisation of the data that answers your question.
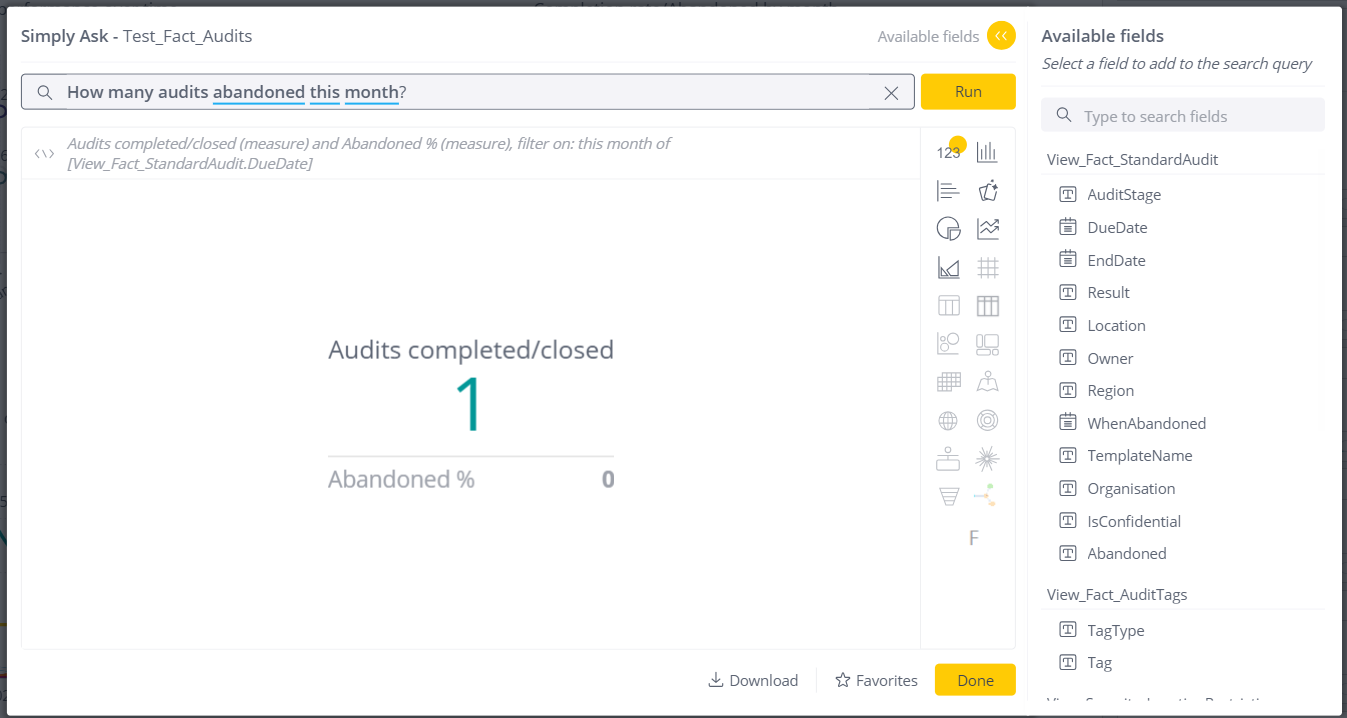
- You can change the type of visualisation used by clicking the different options on the right-hand menu.
- On this menu, you can also see the different Available Fields. These tell you what fields are being used to answer your query and can be used to help you construct a particular query. Click the fields or enter them manually to add them to your question.
- Simply Ask does allow you to be quite specific with you queries, for example, asking for data from a particular date.
- Simply Ask also allows you to forecast your data, for example by asking “Forecast the amount of compliments for the next 4 weeks”.
- You are also able to apply trend lines to your data by asking “What is the trend of…<data>”.
Filtering a Query
- Filters are available to be applied in your queries, including:
- Specific dates and date ranges
- Common timeframe periods
- Common public holidays
- Top/bottom ranking filter
- Aggregate functions
- Break-bys of values by another category
- Text filters, such as ‘Starts with’, ‘Containing’ etc
- Value
- Dashboard formulas
- Dashboard filters
- Sorting by ascending and descending
- Reserved keywords
Saving a Query
- After running your query, you can save your query for later, either by:
- Clicking the pin icon to pin it to your dashboard
- Clicking the download icon to download a PNG image of the visulatiation
- Clicking the star icon to save your query beneath the Simply Ask field